This is a topic I've been thinking about for a while. I think it's something that, especially new, traders don't understand well. So I want to share my ideas around adjusting trades. What is it? Why do I do it? When do I do it? This is a journey every trader must have individually, but maybe this will help some traders out there along the way.
What is an Adjustment?
This sounds really basic, but I think it's important because this is the root of a lot of misunderstanding, in my opinion. What exactly is a trade adjustment? When a trade is being challenged, it's possible to make changes to that trade. Some people think they are “fixing” the trade, but I disagree with that view. I prefer to think about adjusting as buying time to give the trade a chance to work. Most adjustments fall into two major categories:
- Adding capital to the trade
- Realizing a loss to the overall position
In both of these cases, you are taking on some level of risk in exchange for the opportunity for the trade to be successful. The net result can be adding more room to one side, lowering price risk (delta) but in general an adjustment adds some form of risk to the trade, either explicitly in the case of adding capital, or implicitly by realizing some loss that must be overcome in order to make the profit goal or to be profitable at all.
When to Adjust?
This is probably the biggest and most difficult part of adjusting. As one of my mentors always says, “When you adjust is more important that how you adjust”. Early on, many traders use simple strict rules on when to adjust. For example, if the underlying reaches a certain price, or if the position deltas reach a certain level, or at a certain P/L. All of these things are good ideas but over the years I have developed a holistic approach to adjusting. This approach looks at multiple factors. It takes experience for each trader to figure out but hopefully this will help guide some traders out there. Here are the factors I look at together when figuring out when to adjust. Keep in mind that most of my trades are range-bound and non-directional. So my goal in these types of trades is to keep the underlying inside my structure and my price risk, especially delta under control. If you are trading more directionally, some of these concepts may not apply.
P/L
This one seems simple but took me a while to figure out. I have a hard and fast rule: if I'm at an adjustment point and I am up any amount of money, I do not adjust, I simply take it off. I'd rather just take off the trade and put something else on, perhaps even the same trade but re-positioned better based on the new market conditions. Some people might consider that an extreme version of an adjustment. But, in my opinion, if the entire trade is taken off and replaced, it's a new trade. It's really a matter of accounting at the end of the day, but that's how I see it.
Conversely, if I am at my max loss, I am very cautious around adjusting. I can't say I won't adjust at all, but I'm less likely, especially if the adjustment involves adding more risk. I can't say I 100% won't adjust as I did if I'm up money, but it's a strike against adjusting and I will consider other factors as well.
Greeks
When adjusting or deciding to adjust, I always consider the greeks of the trades, both the current greeks as well as the greeks post-adjustment. This is especially true for the price risk greeks, delta and to a lesser extent gamma (although gamma comes into play later). My goal when adjusting is to lower my price risk (my position deltas) because the trade has moved against me and I want to lower the impact of price movement. I don't want to adjust into a trade that increases my price risk.
Looking at delta may also be a reason to not adjust when I might based on the underlying price. If my trade is approaching an adjustment point but my deltas are very low that could be a reason to not adjust and wait to see how the underlying moves. This would be in conjunction with other factors, of course, but it's an important one. For example, if I have a 4-lot on and my position deltas are < 1, I'm far less likely to adjust the trade because my price risk isn't particularly bad. It's safer to wait it out a bit because the price continuing to move doesn't hurt as much. However, if I have 9 deltas (long or short) on that same 4-lot, that's a reason to consider adjusting as on most of my trades I would want to lower the risk of a price movement.
Events
We do not trade in a vacuum. While there are events we cannot predict, there are plenty of known events that effect when/if I adjust a position. As I primarily trade SPX, big events for me are FOMC meetings, some earnings for the larger components of the index and, in the past few years, CPI prints. Other underlyings may share these or may have others as well. But if one of these events is eminent, I may be less likely to adjust a trade and more likely to close it. This isn't a hard and fast rule, but definitely a factor to be taken into consideration with others to build the holistic view.
Another thing to consider is that as big events approach, the greeks don't act as expected. For example IV could nullify positive theta. So if my trade expects to recover based on theta decay, I may not want to hold that trade through a big event if it's already in a position where I am considering an adjustment.
Speed/Direction
Again, my trading style is typically non-directional so most of my trades have risk on both sides. These trades work really well when the market is calm and is staying in a range. But when the market really starts moving, especially in one direction, that may affect my decision with regards to the timing of my adjustments. This goes hand in hand with events above. Some trades look good when they go on, but not so good later on. Not every trade will work, and sometimes the best things you can do when the market conditions change is to just take off the trade rather than try to keep it going.
Time in Trade
This is a critical element to making a decision to adjust. How much time has the trade been on and, more importantly, how much time is left. When I adjust, the idea is to give a trade more time to win. But in order for that to happen, I need there to be time left in the trade. If you follow my content, you know that I avoid expiration week (tl; dr: due to the high gamma which drastically increases price risk) so that means that as that time approaches, I would like to have at least a few days for the trade to work before expiration week starts. This means by Weds of the week before expiration week is about the latest I would likely adjust, especially if that adjustment adds risk to the trade. If the adjustment lowers risk, I may consider it based on other factors but my goal would still be to get out before expiration week or Monday of that week at the latest.
Another aspect of time in trade is how quickly an adjustment comes. I am careful about adjusting very early in the trade and especially careful about adjusting very shortly after making an adjustment. The former is important because it's a sign that maybe this trade wasn't right for the current conditions, the latter because trades need time to recover after an adjustment and back to back adjustments are usually not good in my experience. The most extreme case of that is needing multiple adjustments in a single day. If that is needed, I will likely just take the trade off for a loss instead.
An Example
Here's a trade I did last year where I did both types of adjustments on the same trade. I don't do multiple adjustments on the same trade very often but, in this case, I did and I think it demonstrates the two categories of adjustments.
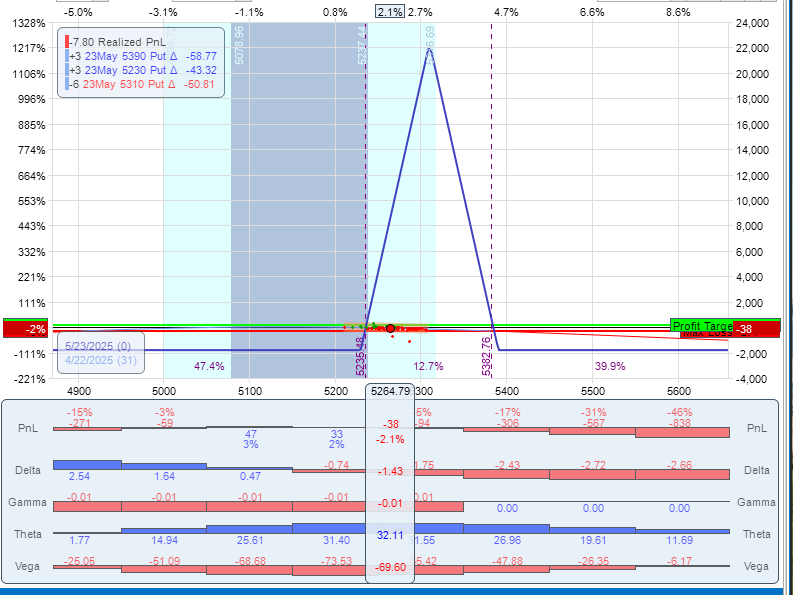
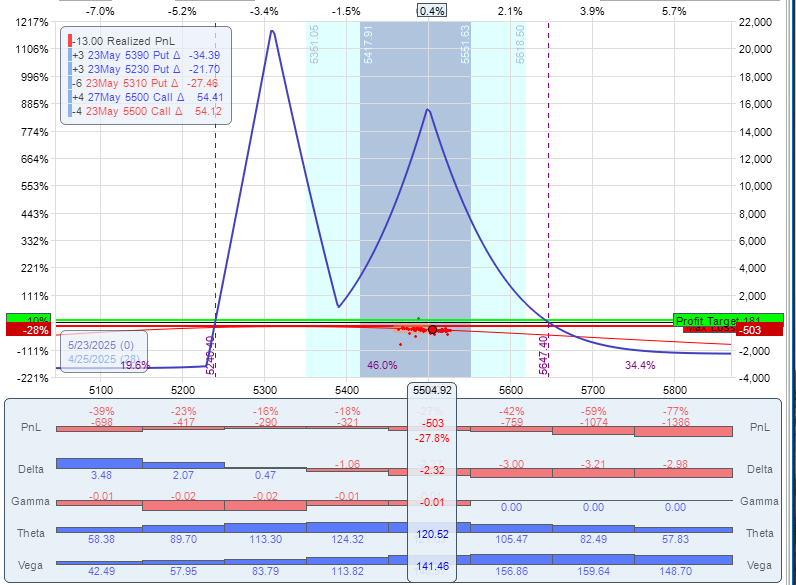
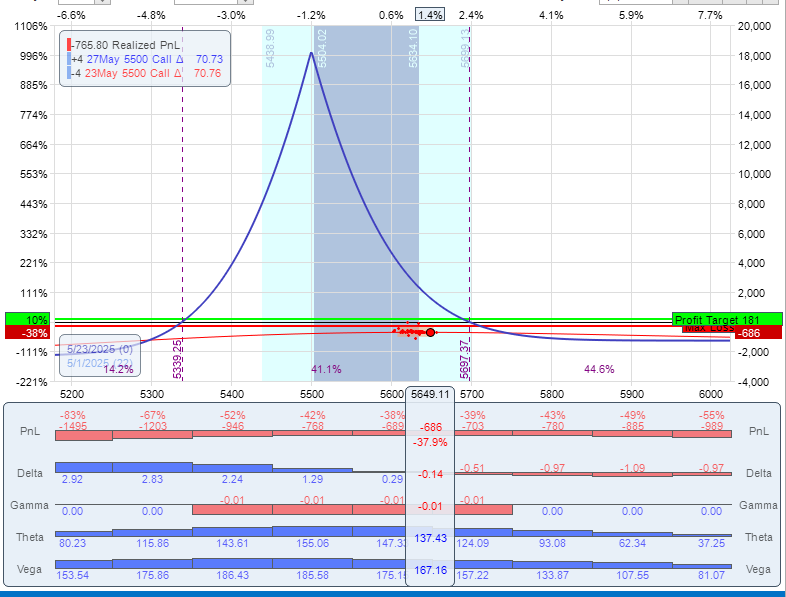
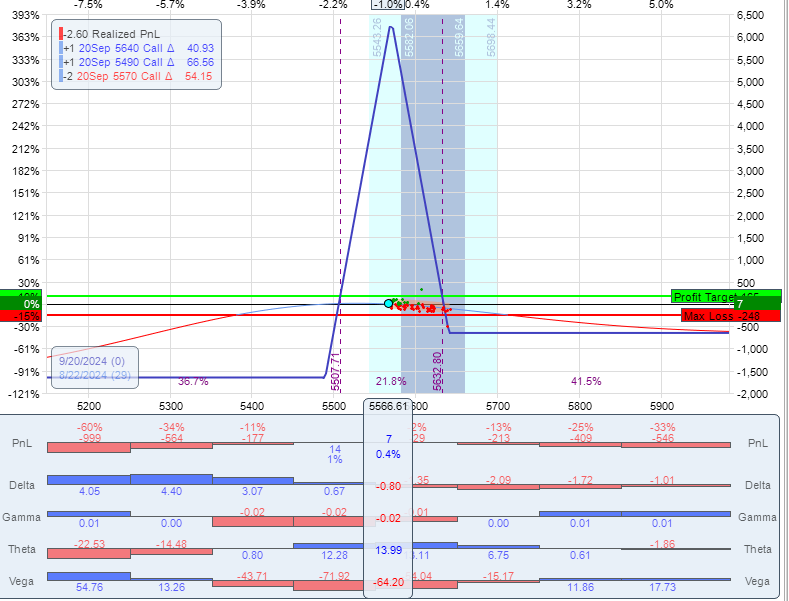
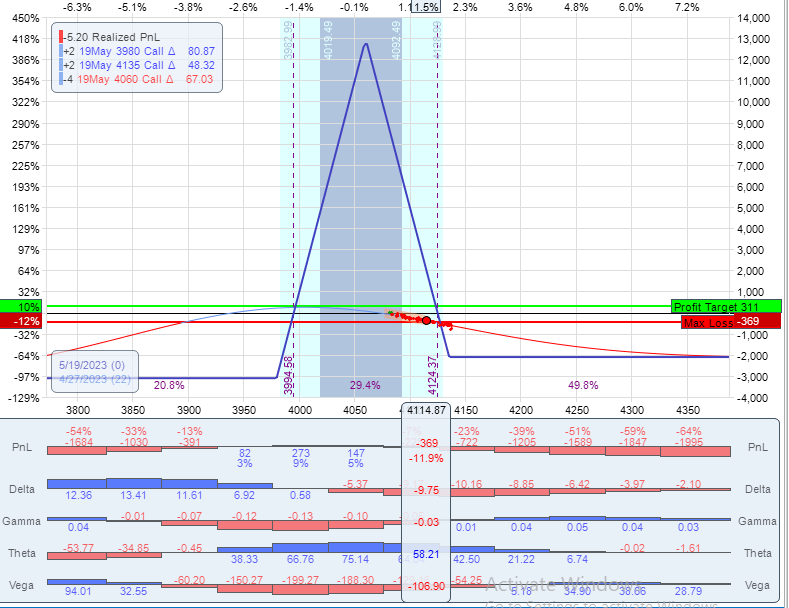
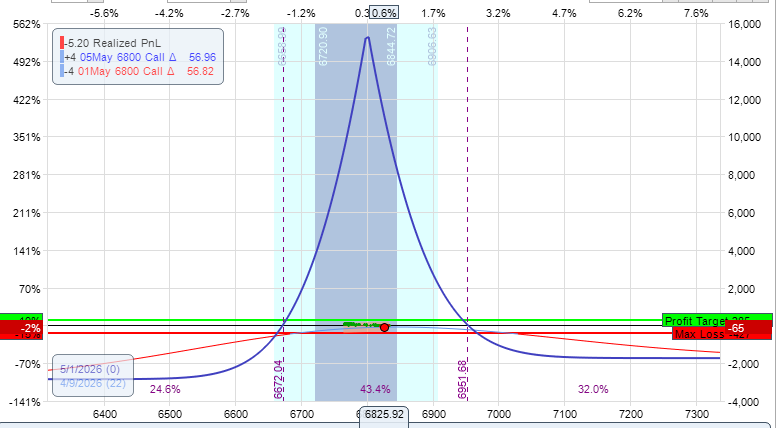
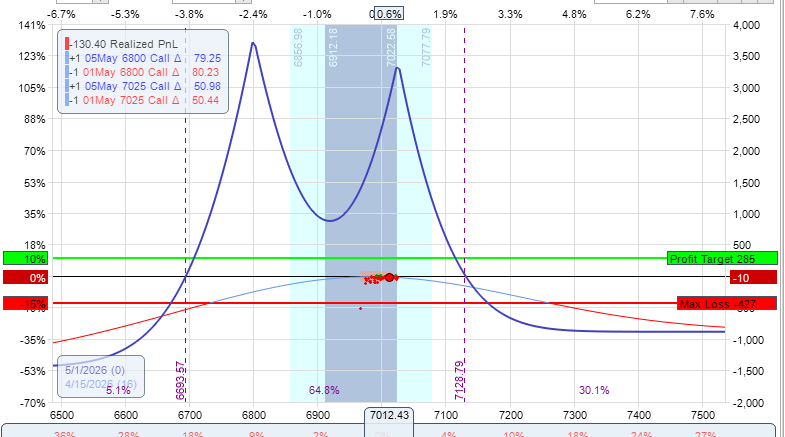
I started out with a 2-lot SPX butterfly centered near the money. This is a common trade of mine when IV is on the higher side as it's short vega. In this case, the very next day SPX goes up quickly and the trade gets into trouble as shown here
So let's run it through my tests:
- Price of the underlying is near my adjustment point: YES
- I am down money: YES
- Position deltas are -9.75 on a 2-lot: YES
- Speed/Direction: Underlying moved here 1 day after the trade went on (1.67 SD move): YES
- Time in the trade: Plenty of time left, only 1 day into the trade [WARNING]
- Major Event: NO
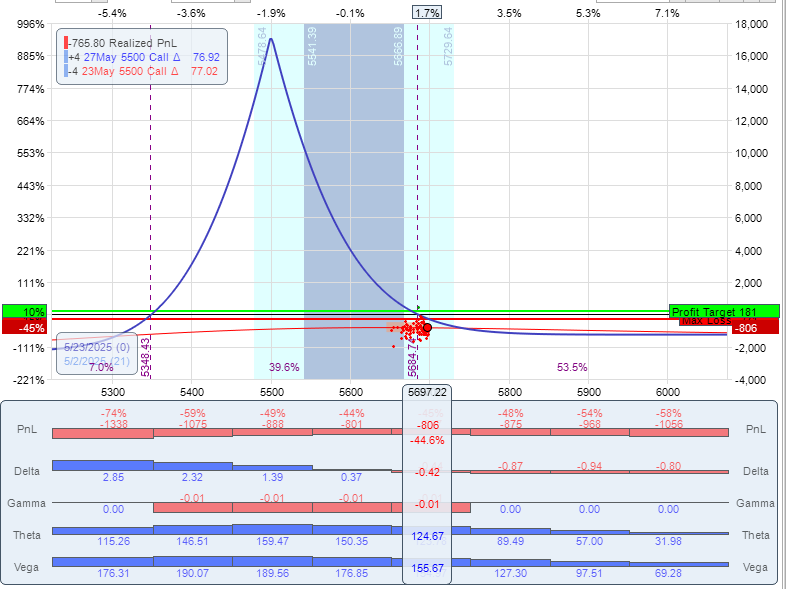
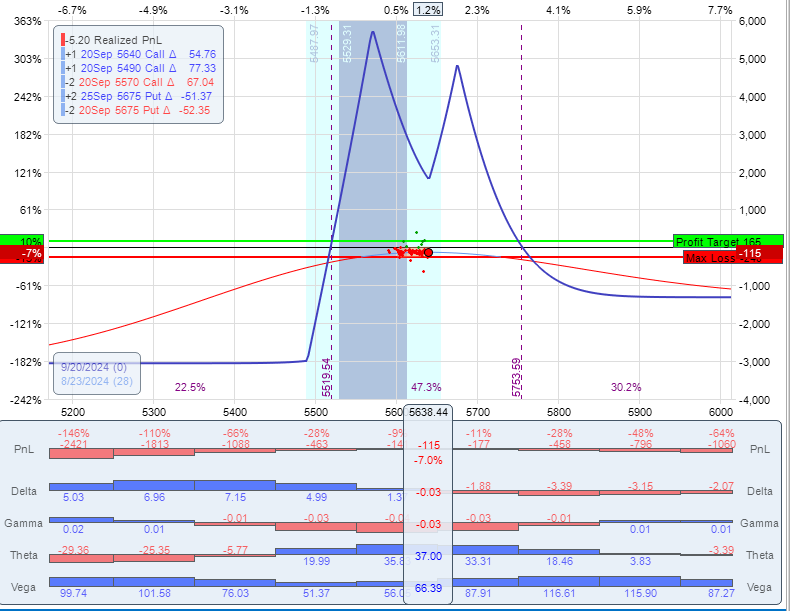
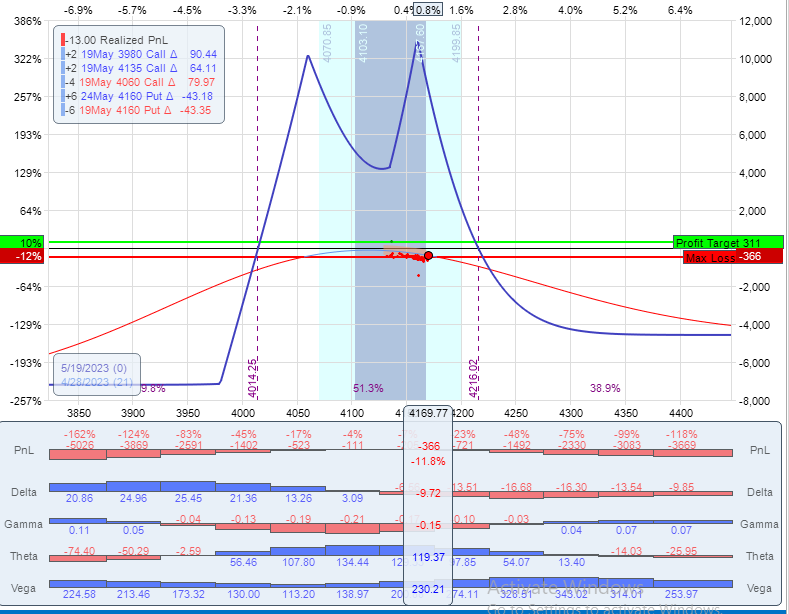
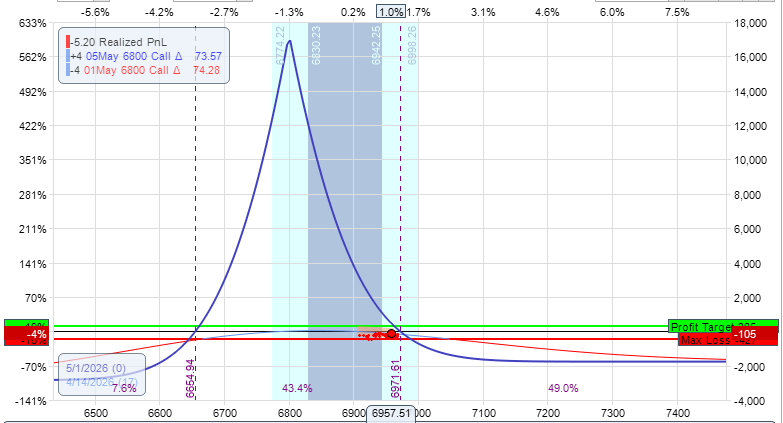
That is enough checked boxes to adjust this trade. The only over-riding factor is sometimes when a trade gets in trouble on day 1, I consider taking it off. The process to determine whether to adjust is a bit more subjective and involves me looking at the graph after and seeing if I like it. In this case, I chose to adjust (if I didn't it wouldn't be a good example). The adjustment I chose was to open up a 6-lot calendar about 45 points above the current price. I opened my short leg in the same expiration as the flies and opened my long leg 5 days later (SPX has daily expirations). Why I chose this is likely a topic for another day reach out if you would like me to cover that, but for this blog, the point is to show the process of deciding to adjust. So post-adjustment, the trade looks like this:
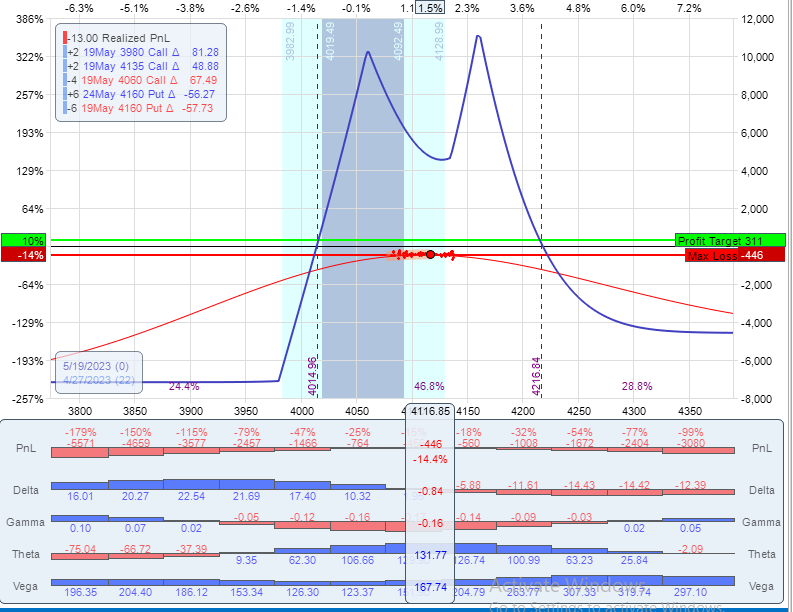
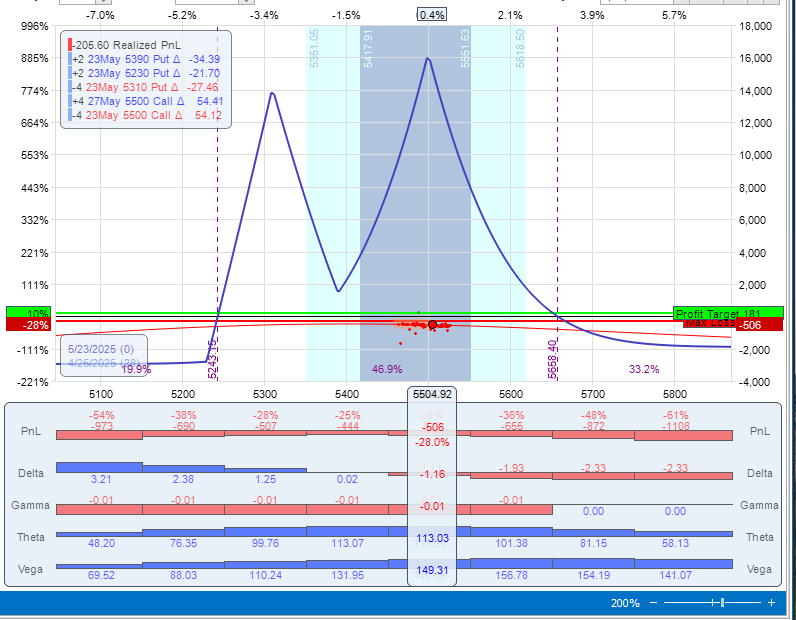
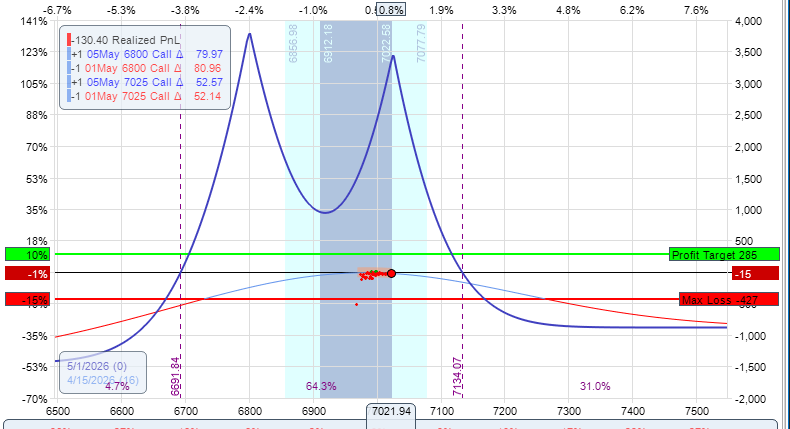
This is an example of adding risk to a trade. I didn't touch the butterflies but I added the calendars to the trade creating this double complex. Advantages of this adjustment are:
- Much lower deltas -9.75 to -0.75
- Room to the upside if we keep going. I'd let this trade go all the way to the center of the calendar, about 45 points higher while still having downside room from the fly.
- Increased theta 58.40 to 131.77
The biggest downside of this adjustment is the increased risk: $3,100 to $5,575 so not quite double but still more risk.
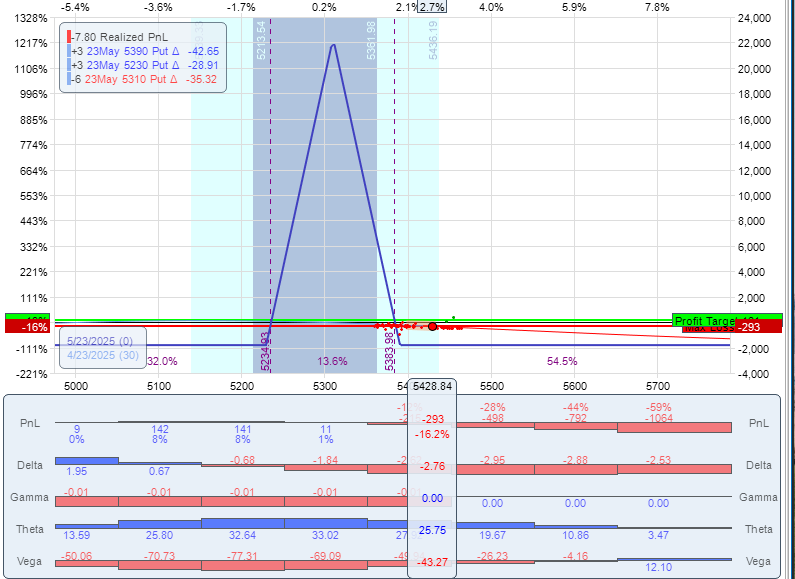
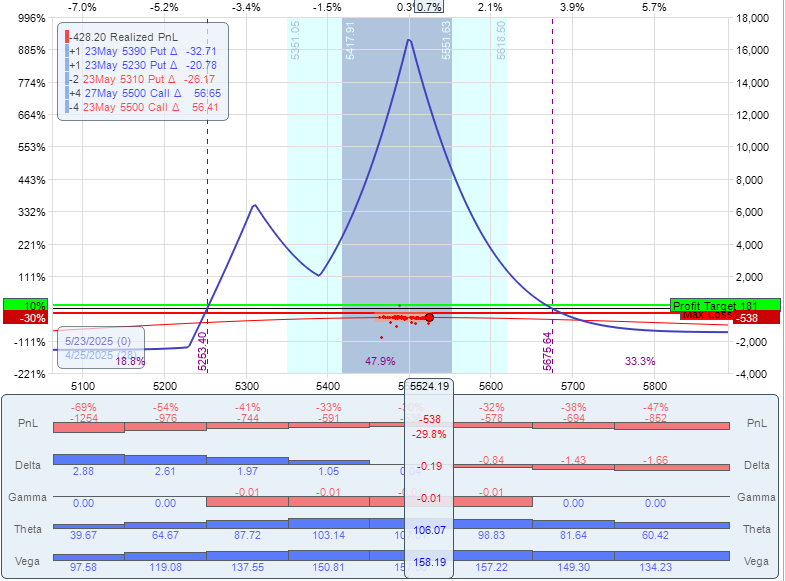
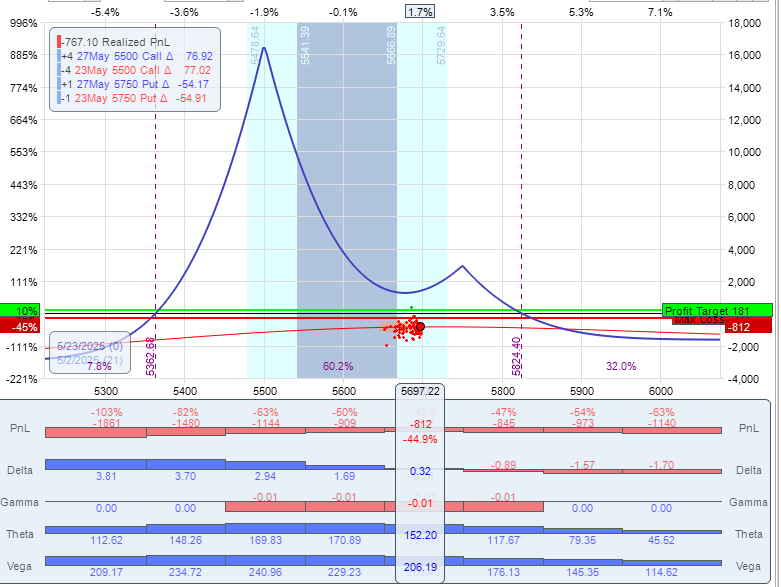
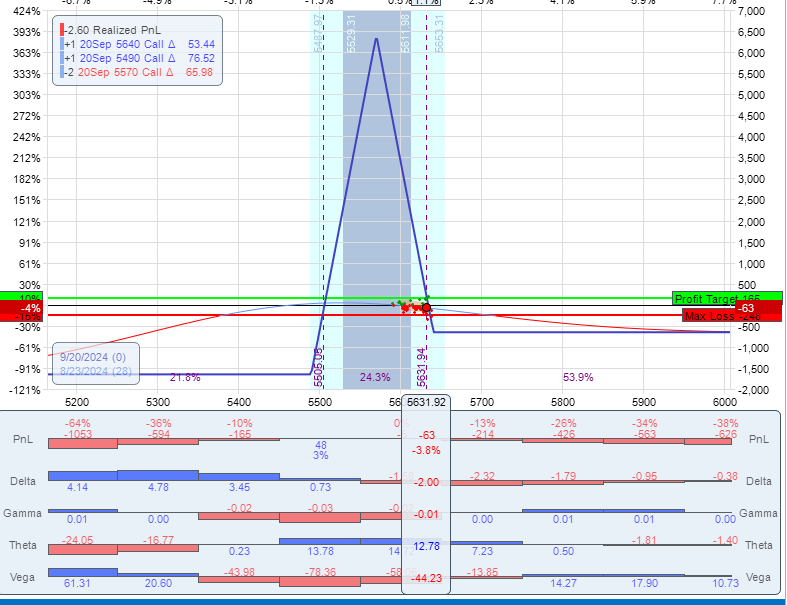
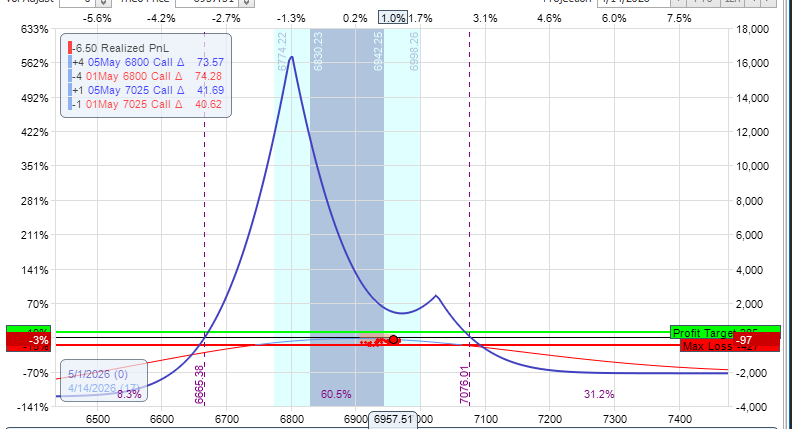
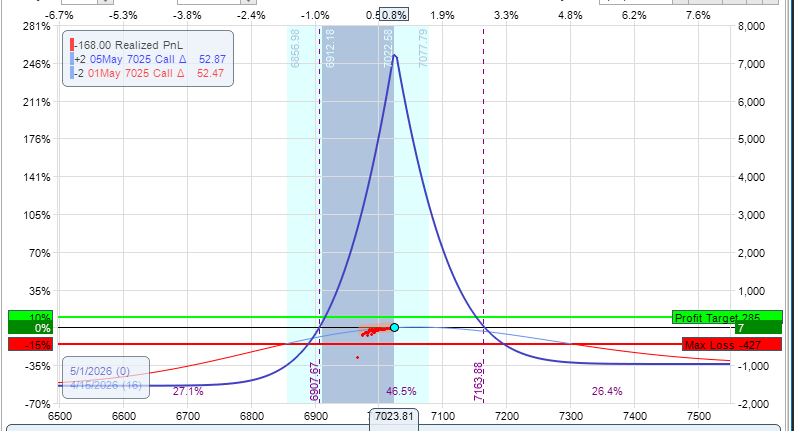
But this isn't over, the very next day SPX kept rising. In fact, it rose past the center of the new calendars I put on the day before. It took all day to do it, but it did, and near the end of the trading day, the trade looked like this:
So let's run this trade through my tests again:
- Price of the underlying is near my adjustment point: YES
- I am down money: YES
- Position deltas are -9.72: YES
- Speed/Direction: Underlying moved here 1 day after the last adjustment: (1.06 SD move): [WARNING]
- Time in the trade: NO (only 1 day from last adjustment)
- Major Event: NO
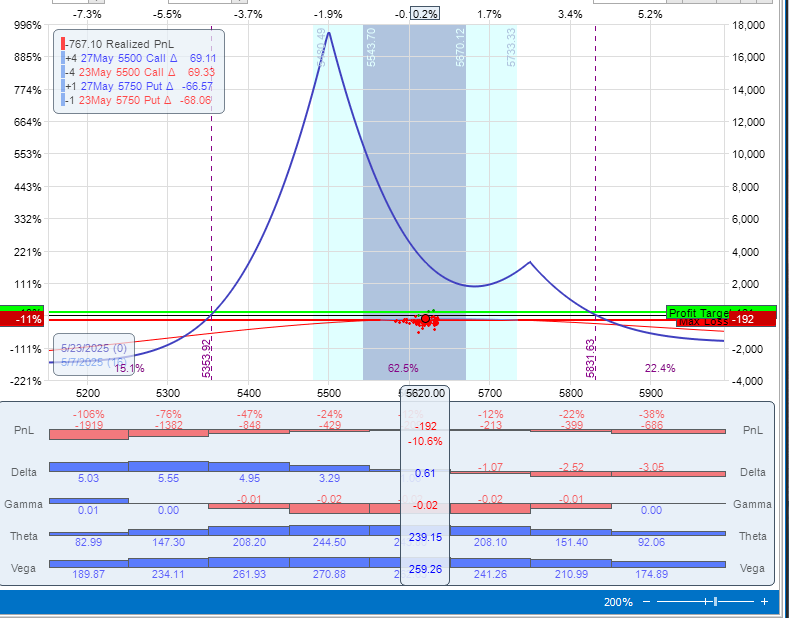
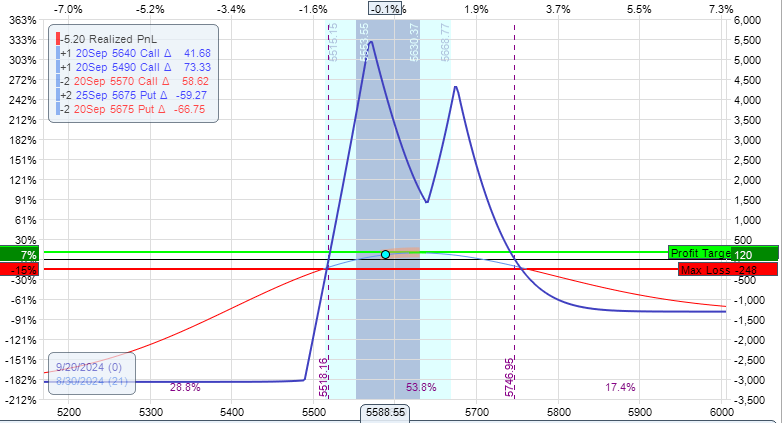
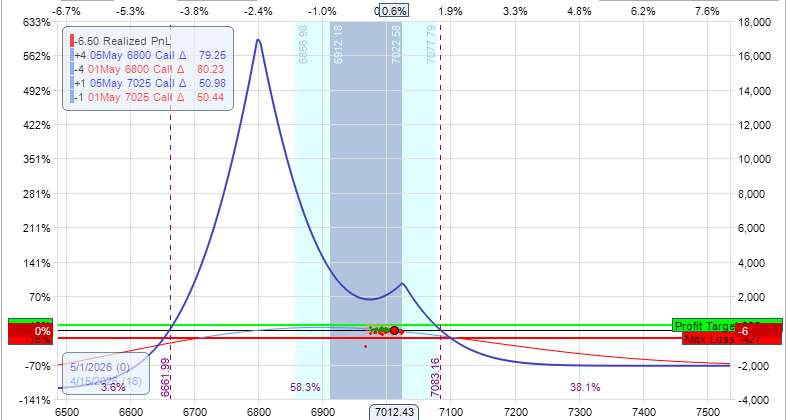
The only real objection I would have to adjusting here is the fact that I just made an adjustment yesterday. I show this to demonstrate that all the factors may not agree and, in those cases, it's up to the judgment of the trader. In this case, I do decide to adjust with the caveat that this trade is on a tighter leash, meaning if I want at least a 2 or 3 days before I would consider adjusting again, especially an adjustment that would involve adding risk to the trade. So I did adjust and now the trade looks like this:
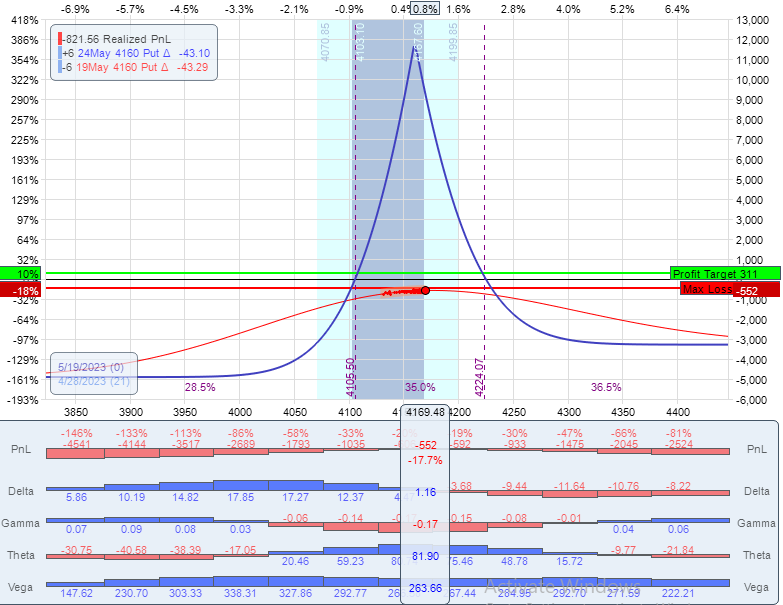
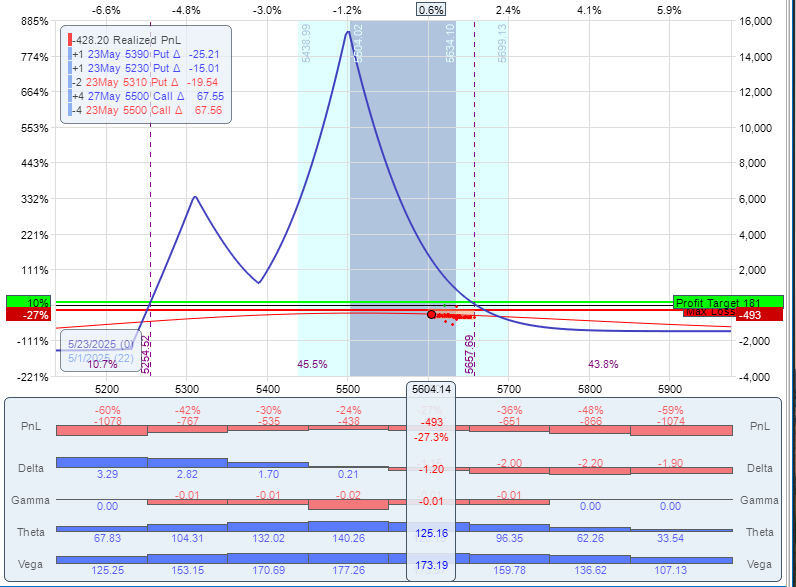
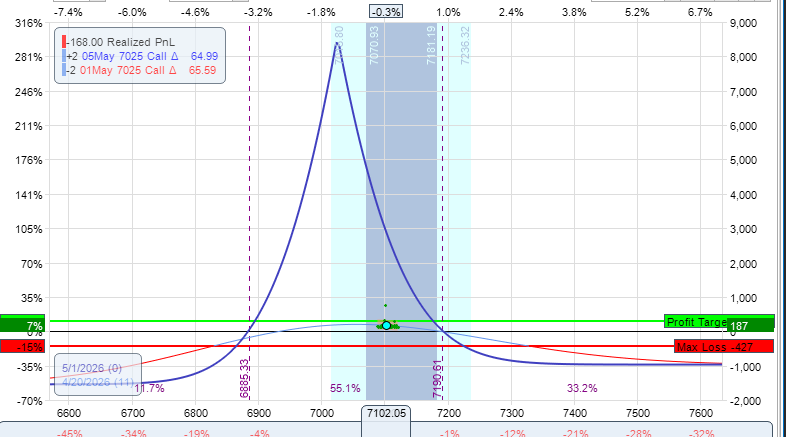
This is an example of realizing a loss on the overall position. I closed the butterflies, leaving only the calendars. So the trade has changed quite a bit, but I still consider this the same trade because the combined trade was one trade. I will note this is really a matter of accounting. Either way I took a loss on the butterflies. It would be fair to just consider the flies a total loss and the calendars a new trade. But the way I trade this, it's still the same trade. Now I am asking the calendars to make up for the loss I took on the butterflies in order for this trade to be successful.
This is an important concept in adjusting. I didn't really fix the trade, I simply bought more time for it to succeed but I am making it tougher for the overall trade to succeed as I realized a loss on the butterflies. This is where traders can over-adjust and keep digging a deeper hole from which the trade will likely never recover. This is why the adjustment decision is so important. It can be the difference between a small loss and a huge loss. That being said, let's review the results of the adjustment:
- Much lower deltas: -9.72 to 1.16
- More room to the upside: the flies are no longer pulling on the upside
- Less overall risk $5,575 to $3,280.
The lowering of the risk was a big reason why I was willing to do this adjustment. The trade is struggling and I'm taking risk off the table. The main downsides to this trade are the theta reduction (115 to 82) and the less downside room as the flies are gone.
I don't want to take this trade all the way to the end because this post is likely long enough. But at a high level I did do one more adjustment, but it was 4 days later, had it been sooner I wouldn't have done it. But 4 days gave the trade sometime to recover. But SPX did come back down and I re-added flies on the downside. Then SPX really calmed down and I was able to close the trade for a profit 6 days later. What made this trade work even with 3 adjustments was SPX slowed down and eventually became range bound. And that was the point of doing these adjustments: buying time to allow SPX to calm down. Sometimes that doesn't happen and the trade just needs to close for a loss. But this is why if you are going to adjust, you must be careful in how and when you do it and having a solid methodology is critical.
To Adjust or Not to Adjust?
I will close this post with a final idea. Do traders have to adjust? The answer is no. There is nothing wrong with having a “no touch” policy where a trade goes on and then is taken off under a set of conditions either positive or negative. There is a simplicity to that approach. But like everything in life, it all comes down to trade-offs. By not adjusting you will likely take losses that could have been avoided if the trade had more time, like in the example above. I could have taken off that trade after one day and just realized the loss and tried something else. The flip side is that adjusting can increase risk and cause bigger losses than originally intended. This means every trader has to decide if adjusting is a good idea or not. There isn't one perfect answer.
This content is free to use and copy with attribution under a creative commons license.
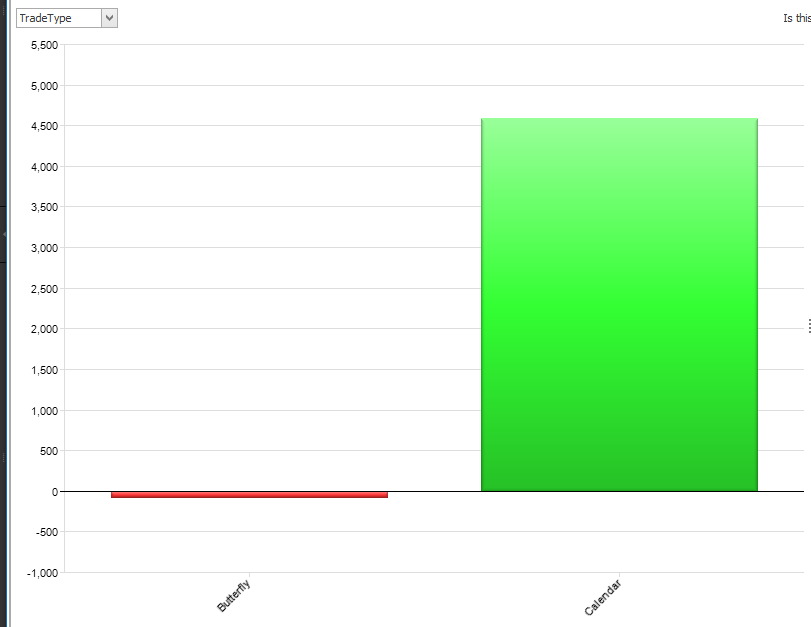
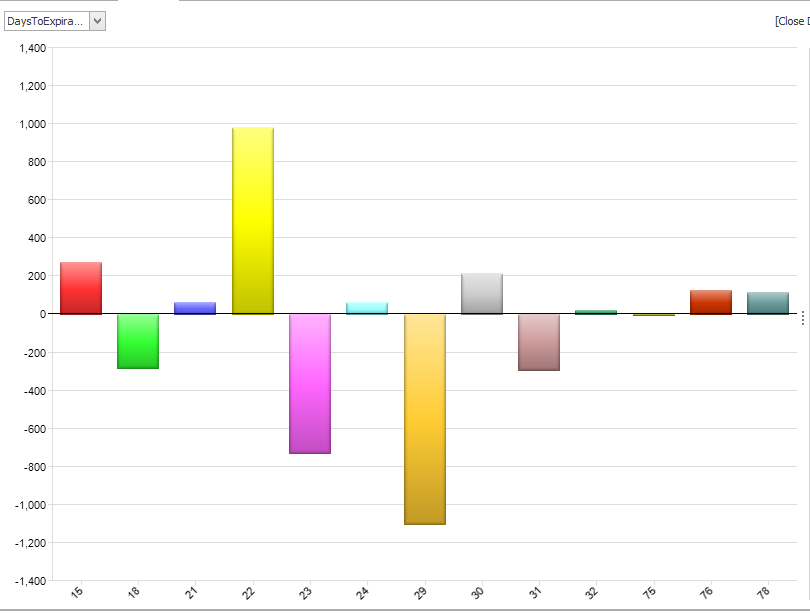
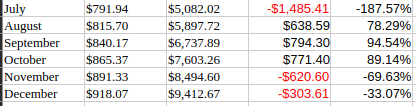
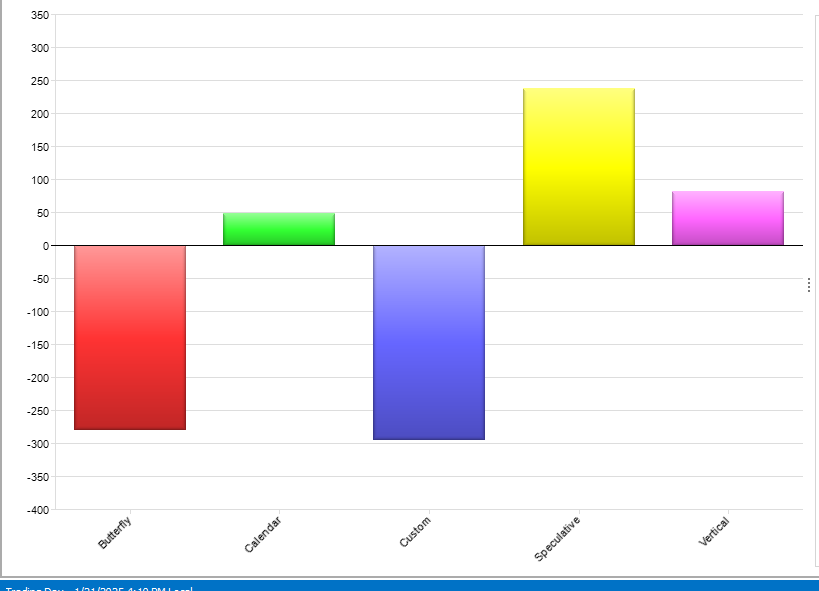
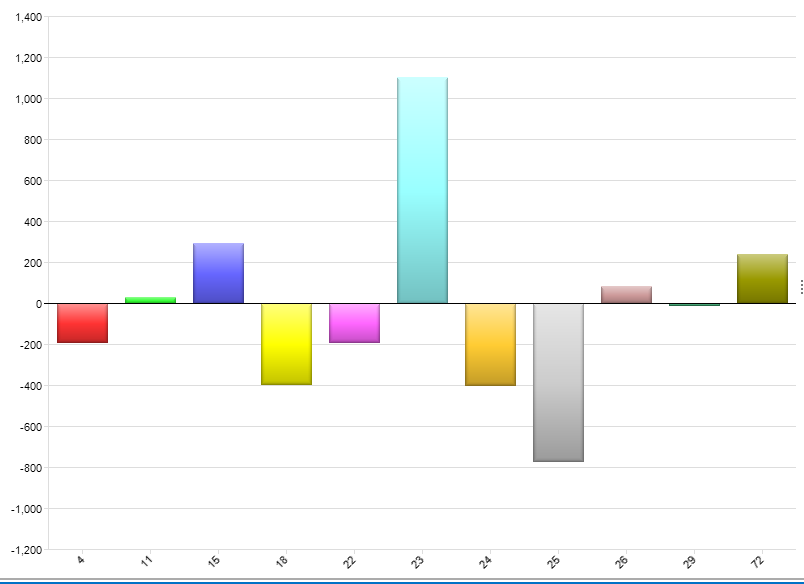
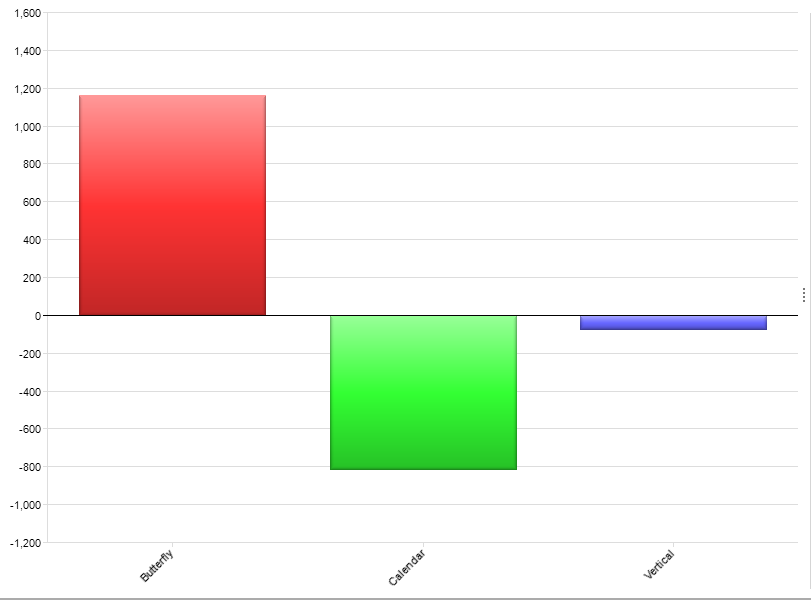
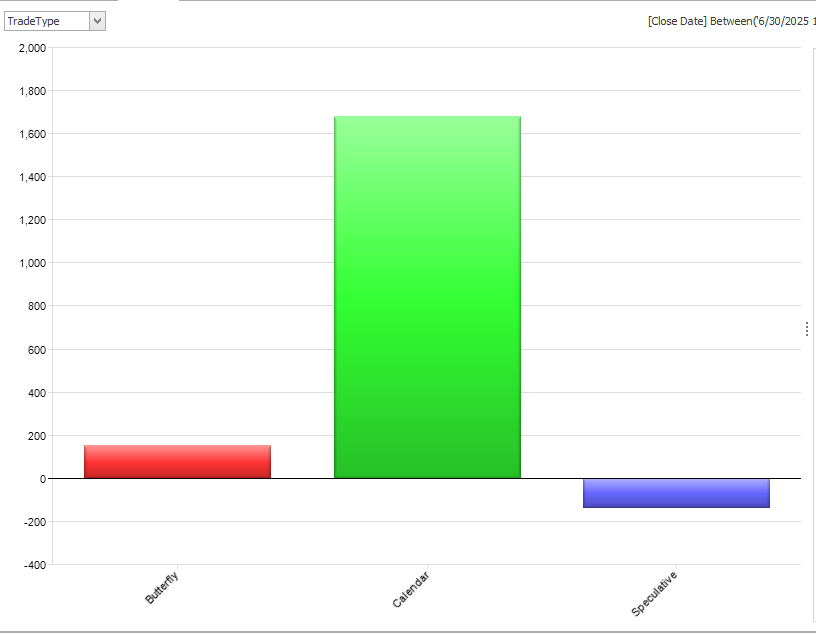 Obviously, calendars were the trade for the later half of the year, but this had more to do with the fact that I did so many more of them as implied volatility was lower than the first half and I traded much more long vega trades. The one speculative trade was a small earnings play in COST. I rarely do earnings plays and this is why...I'm not good at picking direction. I might do one again, but it will be rare.
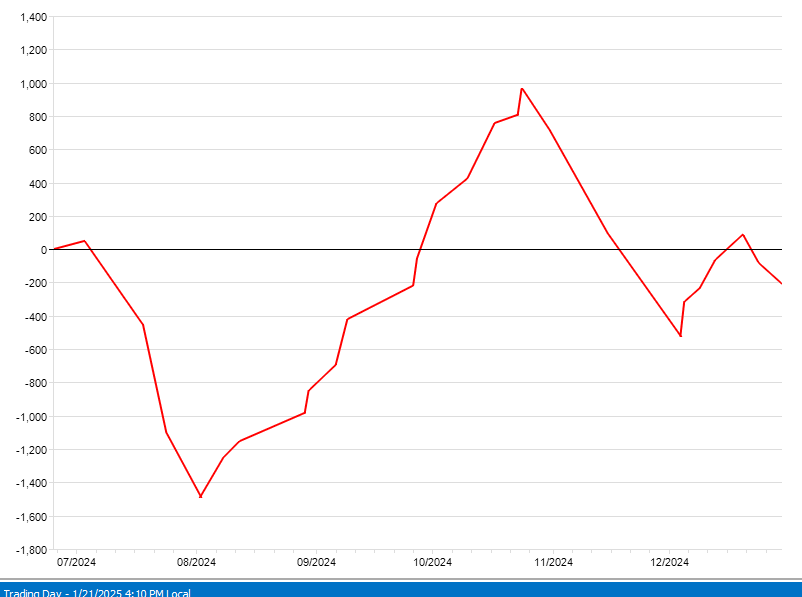
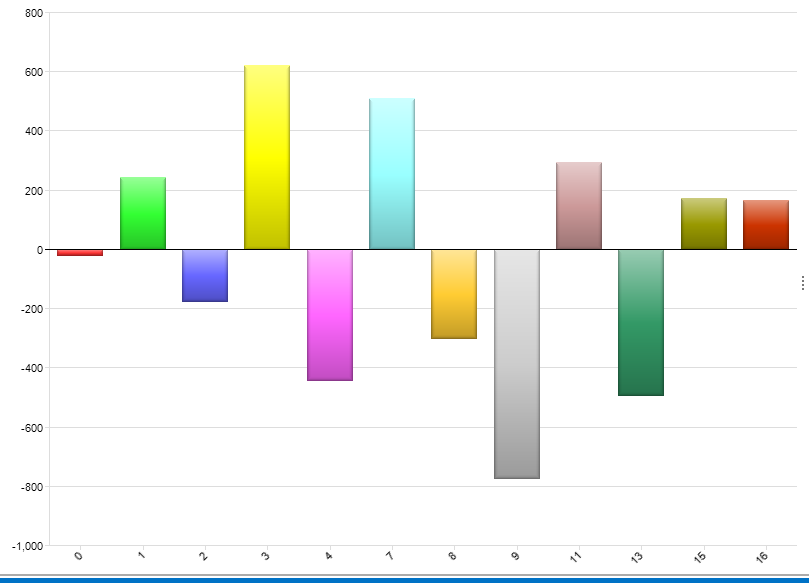
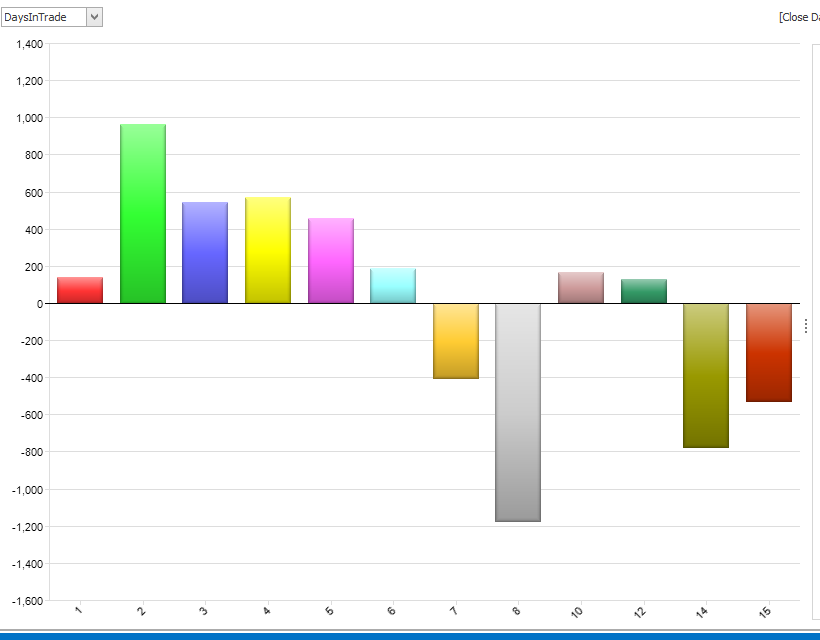
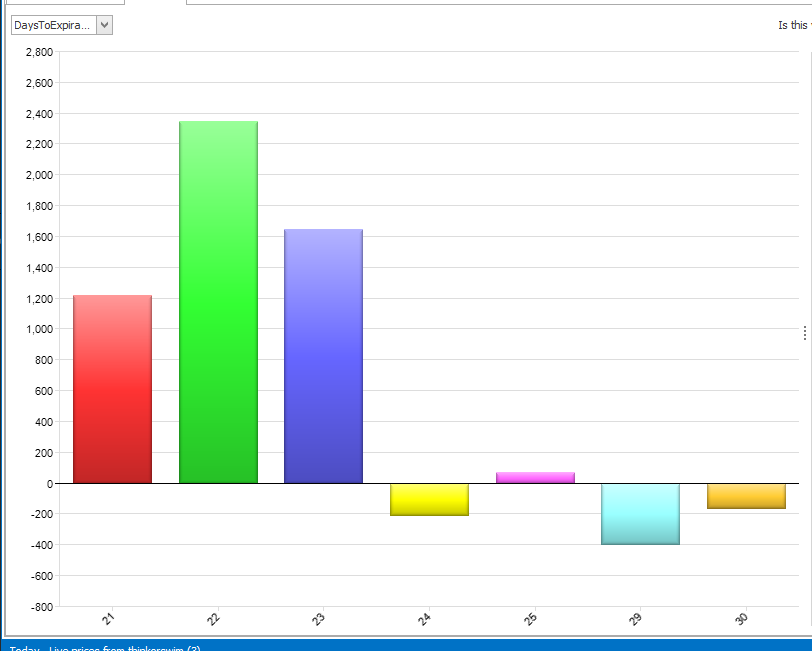
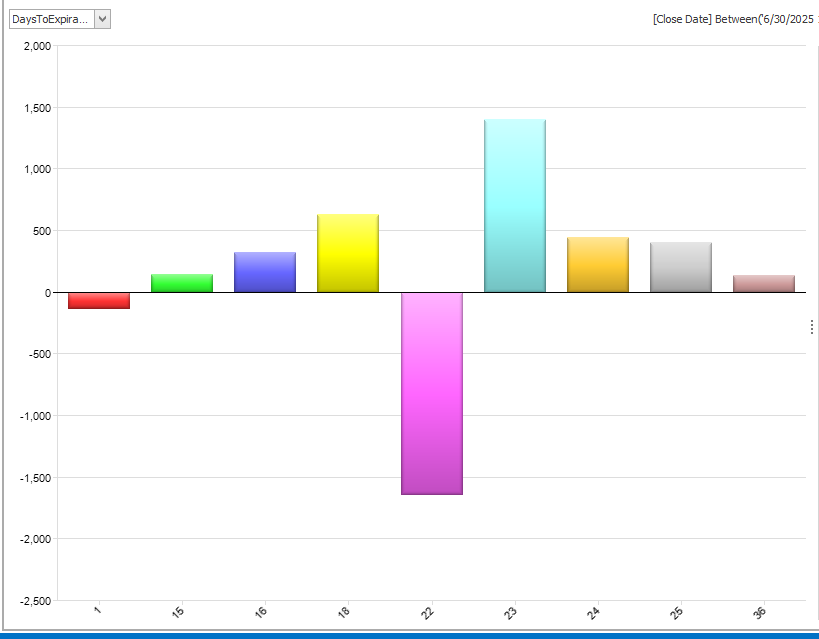 Overall all my DTEs worked ok. The 22-day stat is skewed a bit with the big loss at the end of the year. Most of my trades were between 18 and 24 days and that is where I am most comfortable. I decided at the end of last year to do fewer shorter term trades and I followed through with that in 2025.
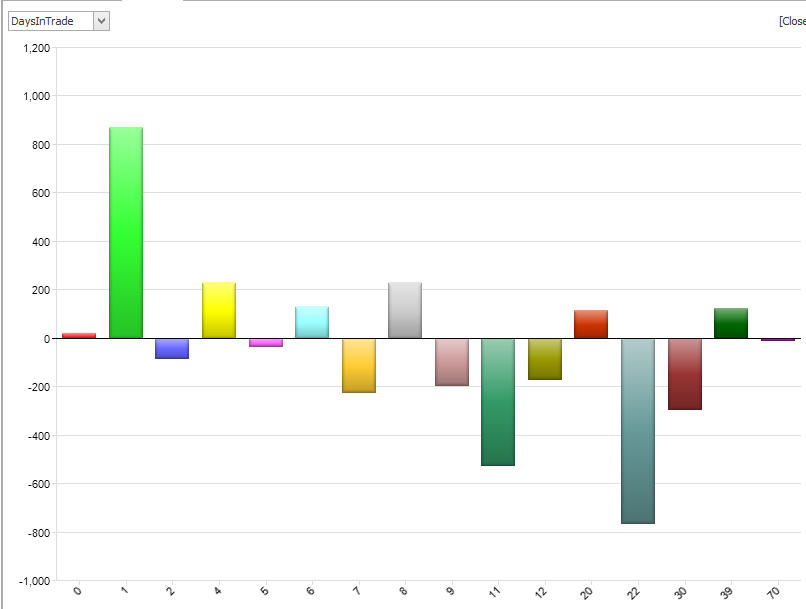
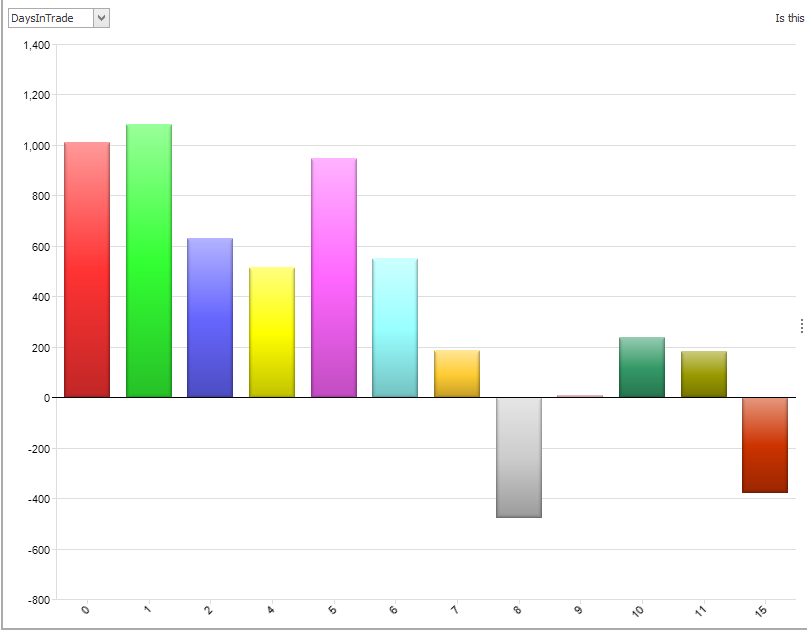
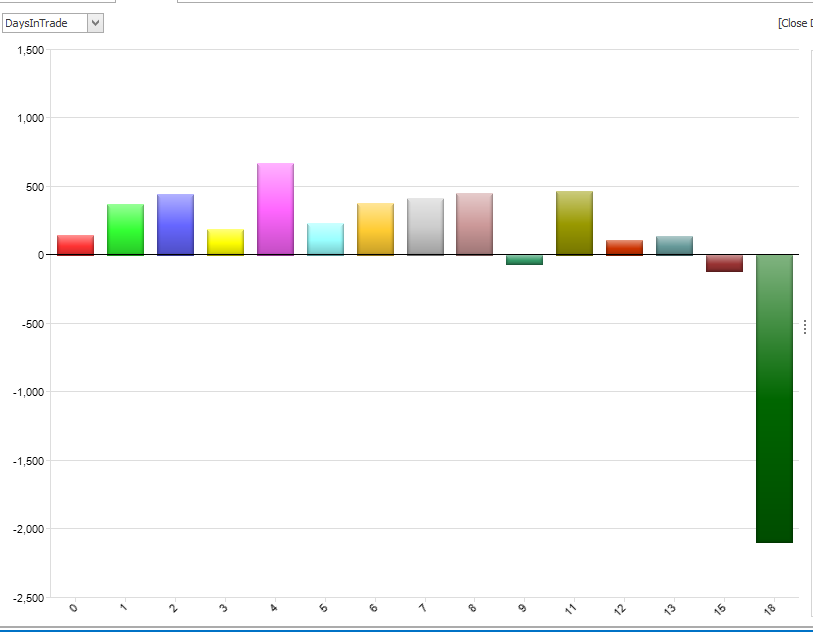 Again, this chart is skewed by the big loss at the end of the year. That being said, 10 days and less is the real sweet spot for my style of trading. At 10 days, I need to put the trade on a short leash.