Trade Review of 1H 2023
This year has the potential to be my best year of trading. I consistently outperformed by goals most months...until June. June was a tough month for me and I took a decent hit as the numbers show here:
1	$529.40	$529.40	     $994.80	 187.91%
2	$545.29	$1,074.69    $134.40	 24.65%
3	$561.64	$1,636.33    $1,536.09	 273.50%
4	$578.49	$2,214.83    $1,038.38	 179.50%
5	$595.85	$2,810.67    $1,446.63	 242.78%
6	$613.72	$3,424.40   -$1,407.80  -230.00%
======================================================
 1H2023         $3,424.40    $3742.50    110%
In the above chart, the first column is the month of the year 1=Jan, 6=Jun. The second column is the profit goal for that month, the third column is the accumulated profit from making the goal each month, the fourth column is what I actually made (or lost) and the fifth column is the % of goal. Then at the bottom there are the year to date totals: profit goal, profit attained, and the % of the goal.
The chart shows that I made money every month except June and vastly exceeded my goal every month except February and, of course, June. My biggest trading goal this year has been to get more consistent and I think so far this year, I have done that. In previous years, I would be up and down every month and usually squeak out a small profit at the end of the year. My current goal is to make 3% on my total capital every month and I was getting around that over the entire year prior to this year. What is encouraging here is that even with the bad month of June where I, essentially, wiped out all of May (my 2nd best month of the year) I'm still, essentially, on goal for the year at 110% of my 1H target.
What Worked? What Didn't Work?
For most of the year, my best trade was butterflies, mostly balanced butterflies. That is because for much of the early part of the year, the market trended down and balanced flies can do well in that environment due to the initial negative delta even though butterflies are negative vega. Delta would work fast enough that vol didn't really matter much. Many of these wins were quick wins coming off in 1-2 days with some going as long as a week.
Then starting in March, I started adding 9-day double diagonals into the mix as well. There were working pretty well and I did end up scaling them up a bit in the coming months. By April, my flies were becoming unbalanced as the market began to move up and by mid-May I stopped flies altogether as vol was getting really low. At this point I substituted calendars for the butterflies. Even though vol didn't pop much, they mostly worked well with only 1 losing trade.
Where I got into trouble was very short term long double diagonals. They worked really well at first, and I think I got a bit too large with them at which time they, subsequently, stopped working as well and I took my larger losses. These things are very volatility sensitive and the center can sag quite a bit as vol goes down and by going as low as 4 days to expiration on them, there wasn't time to get a correction. I still think 4 days can work, but I need to be pickier about when I deploy them and keep them smaller. Size is the first rule of risk management.
Visualizations
To highlight the above, let's look at some interesting visualizations. I'll start with P/L throughout the year.
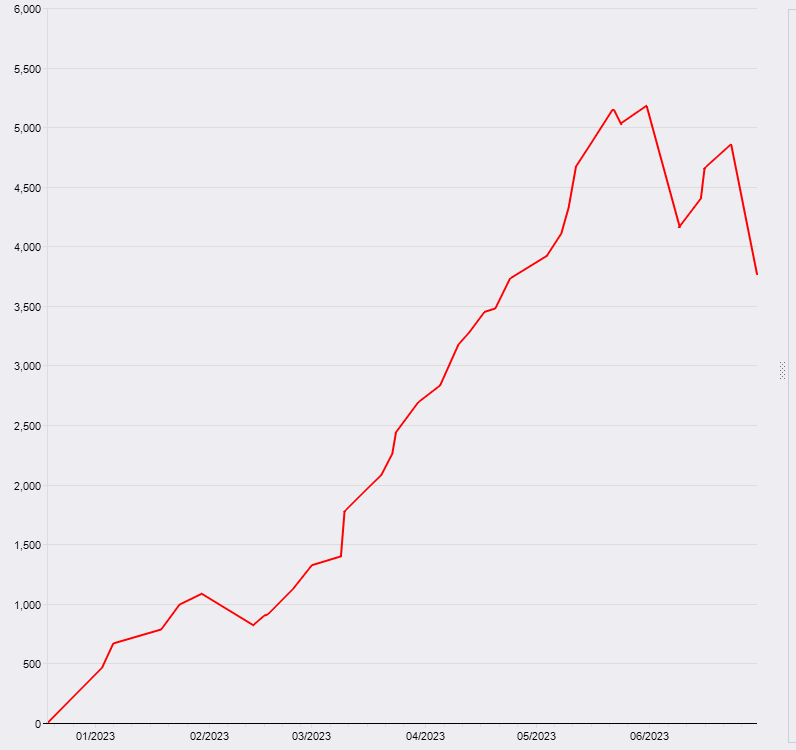
1H2023 P/L
This chart shows the big rise in March-May with the drop in June so no big surprises here.
Next, let's take a look at the trading stats for this year:
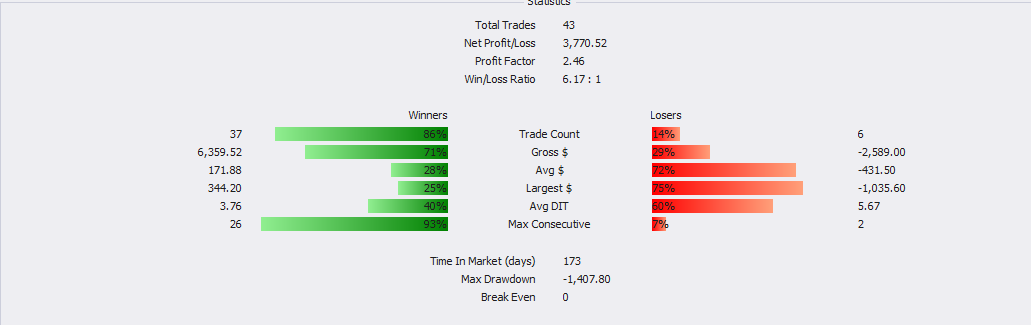
Trade Stats
What I find interesting here is that while the overwhelming number of my trades were wins, the losses were, on average, larger. This was overcome by the sheer number. This validates something I've been saying for years that W/L records don't matter by themselves, the size of the wins and losses matter. In my Weekly Trade Reviews I determined that there were opportunities on my bigger losses to take them off earlier and make those losses smaller. If I can go that in the 2H of this year, I would expect to perform better.
Next, here are the types of trades and how they peformed:
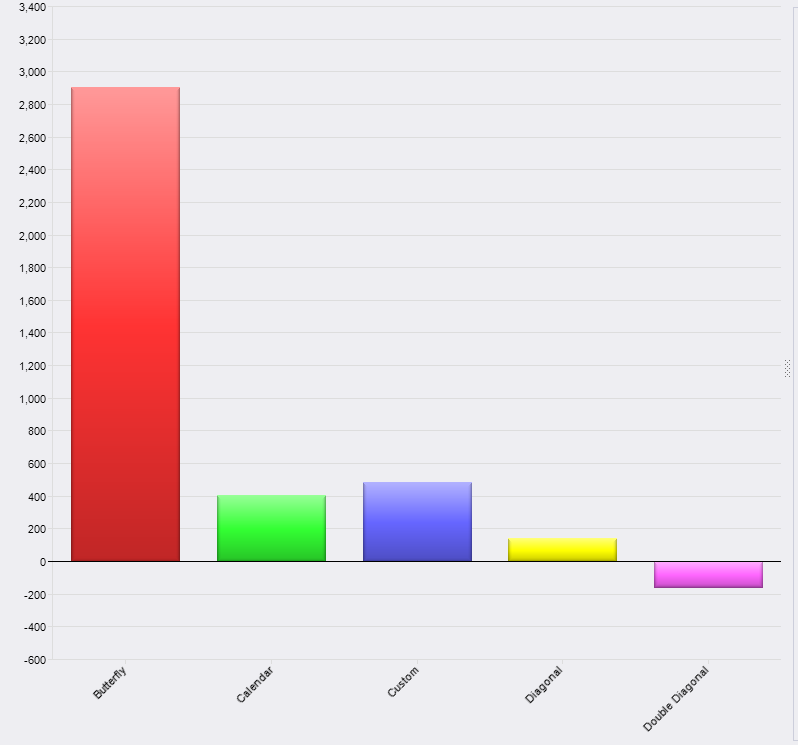
Trade Types
This reflects what I stated earlier that the butterfly was the best performing trade type due to market conditions early in the year. I did some digging into the “custom” and those 2 mis-labeled trades: one was a calendar, the other was a double diagonal. This skews the double diagonal total which would have been slightly positive rather than negative which means all my trades were net positive.
Finally, here is the performance based on days in trade:
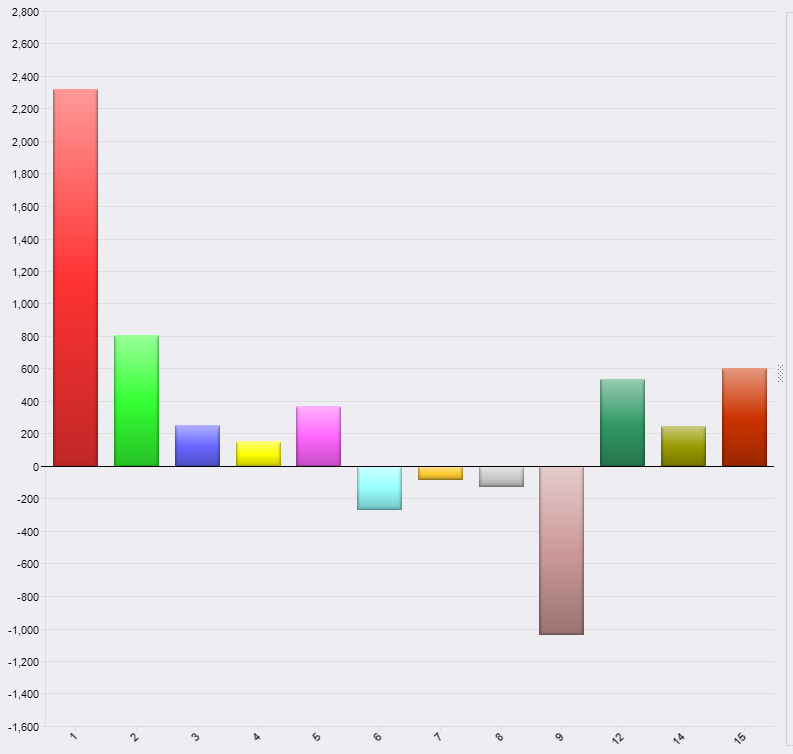
Days in Trade
This confirms that overall my best trades tend to work quickly. The 9 days in trade loss comes from a single trade that had a bad loss. The danger zone this year has been between 6 and 9 days.
Final Thoughts
While June was definitely disappointing and a bit humbling (in a good way), I like how 2023 has worked out so far. I am going to be more careful with the long double diagonals and I may decide to re-introduce some flies at some point, although it's tough to do with vol so low right now. But it wouldn't surprise me if volatility returns at some point this year. We shall see.
As always, feel free to reach out if you have questions, comments, or just want to talk trading.
This content is free to use and copy with attribution under a creative commons license.