Originally posted on August 3, 2022
Once again, I know it’s been a good while since I’ve done a real trading blog but this idea came to mind and I think it has potential. I create all of my trading content for a few reasons. Of course, I like to share ideas and talk about trading options but I also do it because I believe it makes me a better trader. Reviewing all of my trades publicly on a weekly basis forces me to look at what I’m doing in a critical manner and take lessons from it. I feel a certain amount of accountability by posting my results and my rationale every week. Trading can be a very solitary business and finding ways to hold myself accountable is important for me.
So in that spirit, I am thinking about starting a new series of reviews that takes a higher level look to get a better idea of how I’m trading. The weekly reviews are important, but to really see how things are going at a higher level I want to do semi-annual reviews. And instead of just doing another video, I’m switching it to be a blog post. I’m going to start with the first half of 2022 and if I find it useful I’ll continue to do it twice a year. I can say that just doing the research on how I did was interesting and useful. I hope some folks out there find it helpful as well.
My Goals
So since this is the first post in this series, I think it’s a good idea to state what my goals are for this trading account. This account is a learning account for me. It is quite small compared to other investment accounts, retirement accounts, etc. but the purpose is to learn how to trade consistently. If I can get consistent returns, I’ll increase the size and go from there. The trading decisions I make in this account aren’t that different from a larger one outside of the dollar figures of the trades. So if I can consistently do well in this account, I believe I can handle something much larger and, possibly, make it a real income stream.
That being said, my goal is to make 3% of my account balance per month. Compounded monthly, by my calculations, that would be a 42.5% annualized return. Feel free to check my math on this as this isn’t my strong suit, but I put in my starting balance for the year of $16,705, and I ran it through a compound interest calculator at 3% per month and the expected balance at the end of the year was $23,817.34. So that’s a gain of $7,112 (I dropped the cents for simplicity). Taking 7112/16705*100 gets me to 42.5%. For most investments that would be fantastic but I think it’s possible to get at or near that with the options strategies I employ. The goal of this account is to see just how feasible that actually is for me.
My Results
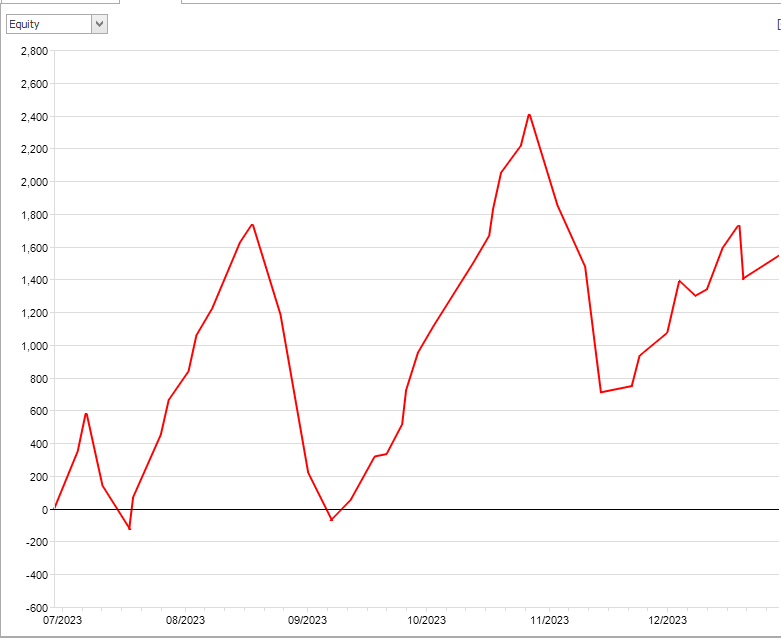
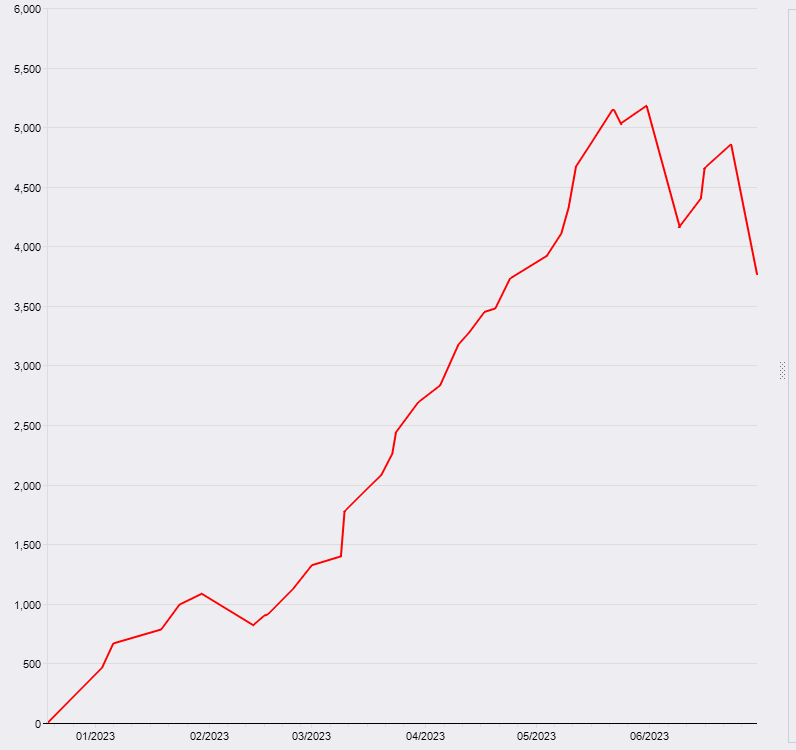
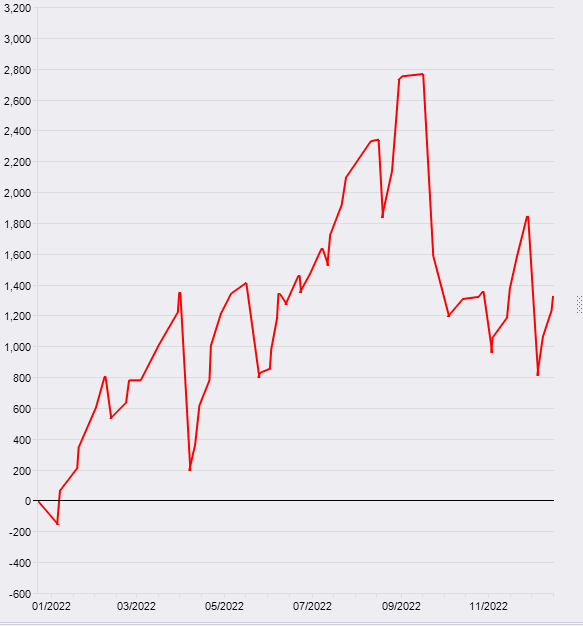
So now that I’ve stated my goals, how did I actually do for the first 6 months of 2022? 2022 has been a year that, I think it’s fair to say, has been a challenging investment environment with all the major indices down for the year. I know I’ve seen my retirement accounts take a hit as I’m sure most of you have as well. Because my goal is monthly I took my monthly results based on closed trades. If a trade was still open at the end of month, it was not counted until it closed (usually by the next month). All that being said, this is my first draft of tracking my progress:
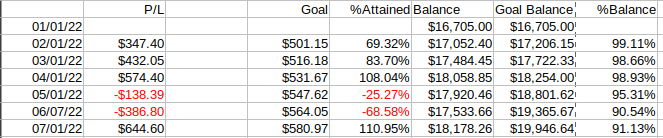
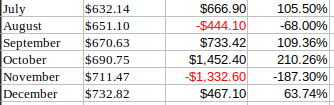
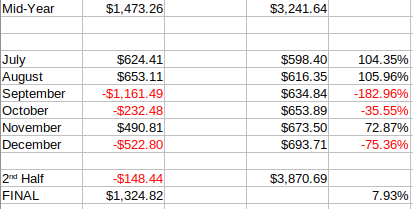
Monthly Results from 1H 2022
Note that the dates reflect the results of the previous month, so Feb 1 is the results for Jan, etc. The columns are as follows:
- P/L: This my Profit/Loss for the month (again based on closed traded)
- Goal: This is my goal for the month based on making 3% each month. The goal assumes that the goal was completed the previous month so it goes up regardless of how I actually do.
- %Attained: This is the percentage of the goal that I attained.
- Balance: This is my actual balance (not including open trades) on the first day of the month
- Goal Balance: This is where my balance should be based on making my goal.
- %Balance: This is where I am with respect to the goal balance on the first of the month.
I fully expect that I may change this format at some point and if I’ve messed up an idea here please reach out either via comment or email and let me know where I messed it up. Again, this is my first attempt at doing this level of tracking so it’s entirely possible I missed something or just messed it up.
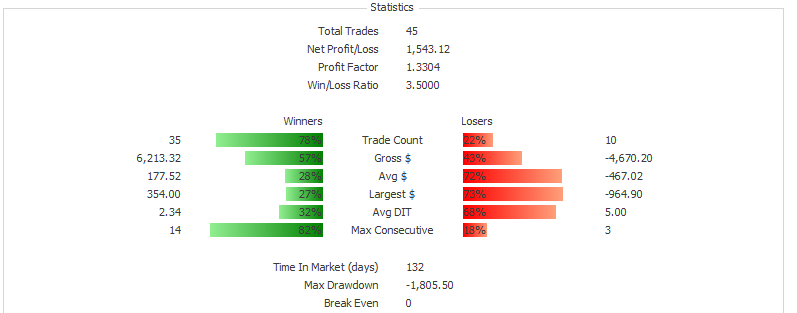
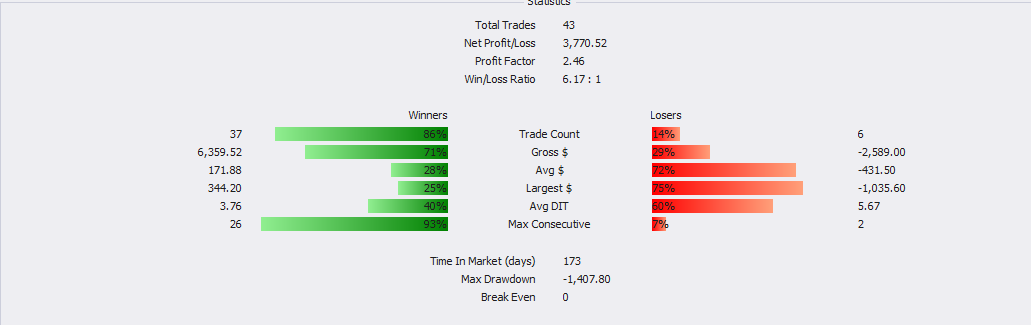
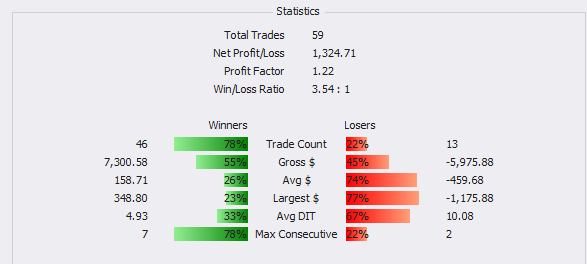
As to the results themselves, you can see that I made money 4/6 month and made or exceeded goal 2/6 months. That’s not too bad given the market conditions of 2022. If my numbers are correct my balance at mid-year is 91% of where I should be based on making 3% per month.
What Worked?
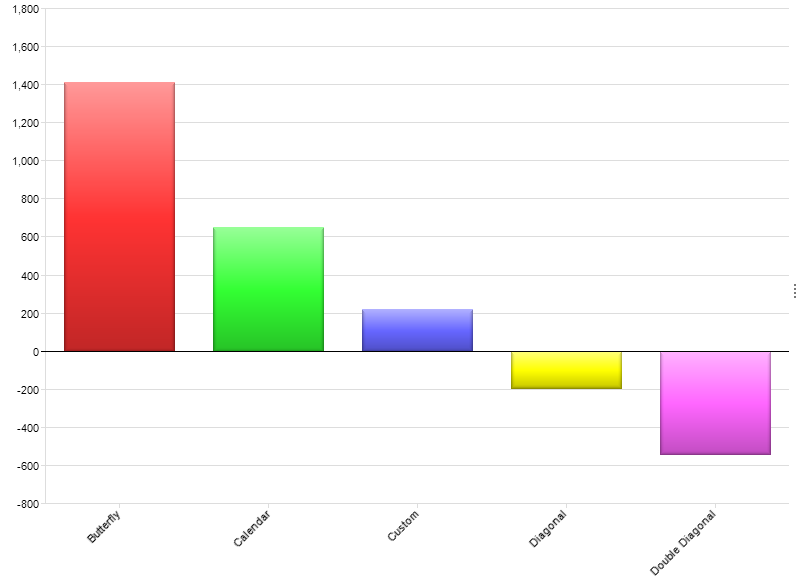
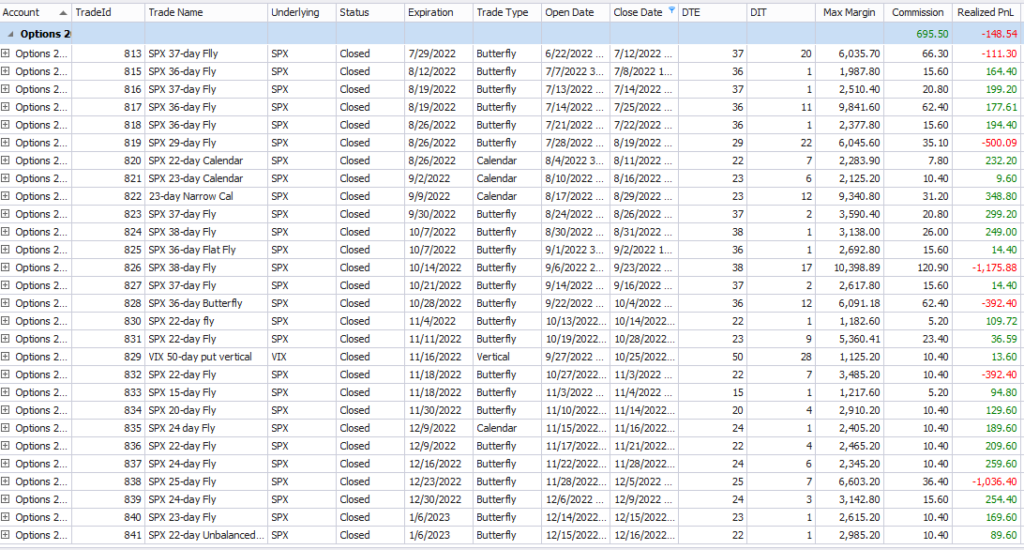
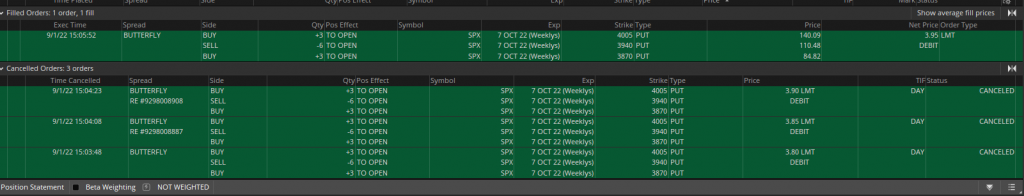
SPX BUTTERFLIES
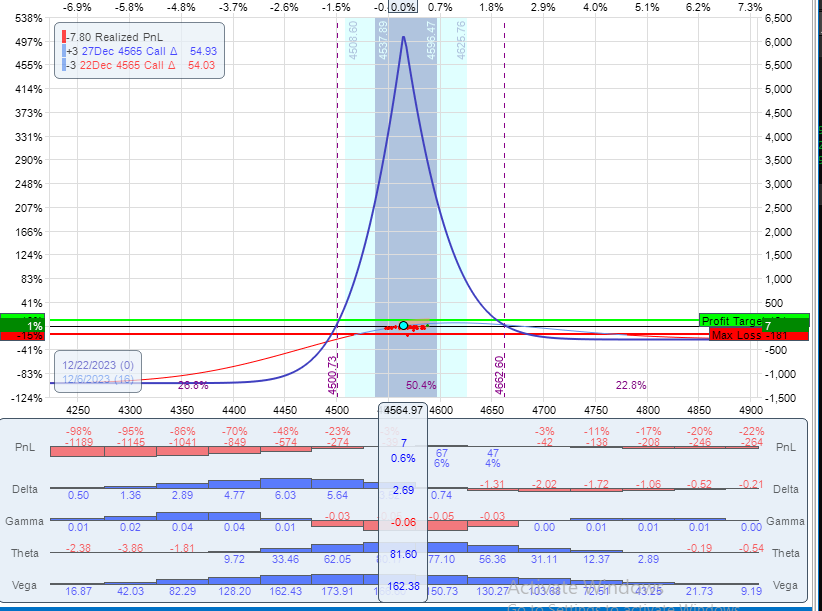
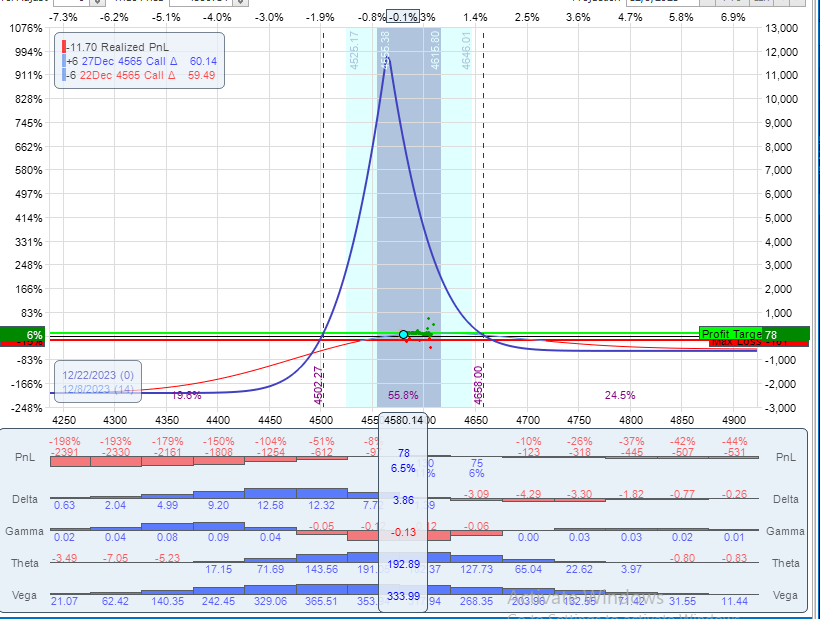
The most common trade of this year was SPX butterflies and they worked most of the time quite well. I’ve been doing these when VIX is between 20 and 30. Because I primarily trade SPX, I use VIX as a guideline for SPX volatility. Butterflies are negative vega and 20-30 has been generally on the high side of the normal range really since the pandemic started around March 2020. I like butterflies here because they are negative Vega and so they will benefit from volatility falling. I have been doing them mostly balanced so that when I first put them on they have very little downside risk as the downside has been pretty strong this year. There have been 13 of these trades that have closed in 2 days or less for 6-8%.
VIX PUT VERTICALS
When VIX has charged up into the 30s (usually above 33) I don’t like trading SPX as it’s too volatile. So when that happens I’ve been putting on longer term (45-60 days to expiration) put verticals to take advantage of the eventual drop in volatility. So far VIX has not stayed above 30 for more than a few weeks and so these have worked out pretty well. Not much to do with them except watch them move around a lot, but it gives me some way to try and make some money while volatility is too high for SPX trades
What Didn’t Work?
GLD CALENDARS
Another trade I was playing with while VIX was high was short term (1-2 weeks) GLD calendars. I had some success with them at first but, ultimately, concluded that they were too expensive to put on at any decent size (I usually had to put on 15-25 lots which are 30-50 contracts) and that was too much for these trades to make up to make decent money vs the risk. The idea wasn’t bad (GLD isn’t necessarily tied to SPX volatility) and I did win a few of them. But, I stopped doing them until the price or volatility of GLD gets high enough that I don’t need to put on as many contracts and get my expenses down.
What is Missing?
SPX CALENDARS
Since March 2020, I’ve been putting on SPX calendars when VIX is under or near 20. I like these because calendars are positive Vega and benefit when volatility rises. While I still like this trade, I was only able to put on 1 during this 6 month time frame as VIX stayed on the higher side when I was ready to put on a new trade. That’s not to say I won’t do them (or use them to adjust a butterfly on the upside when vol is low), rather, there were not as many opportunities to use them as there was, for example, last year.
How Could I Have Done Better?
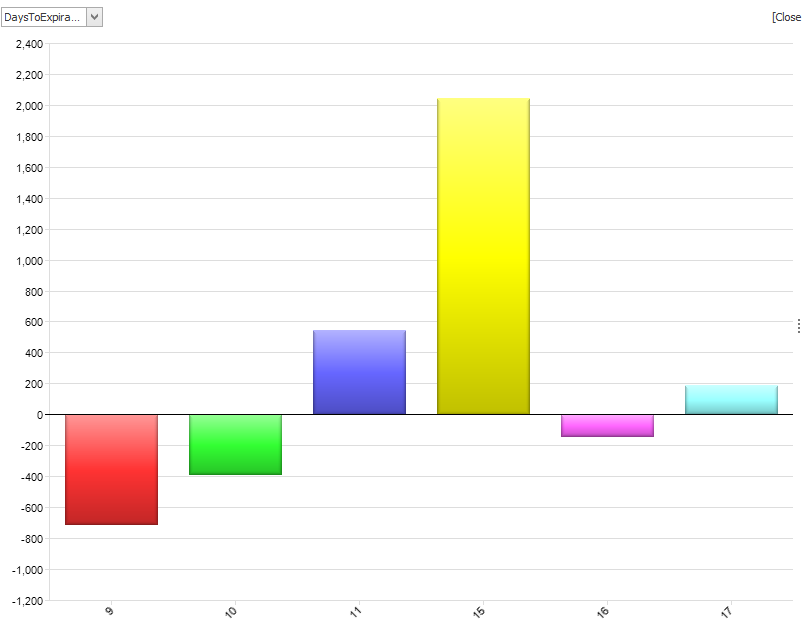
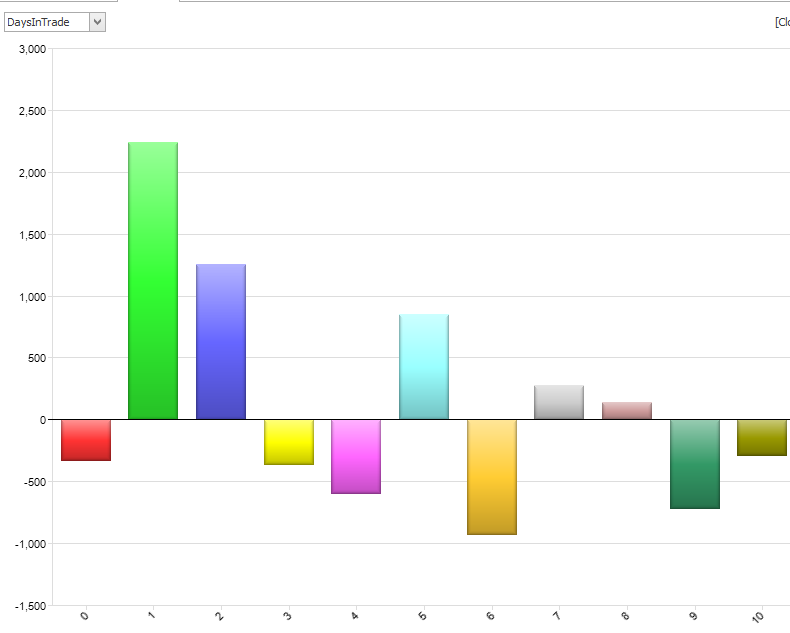
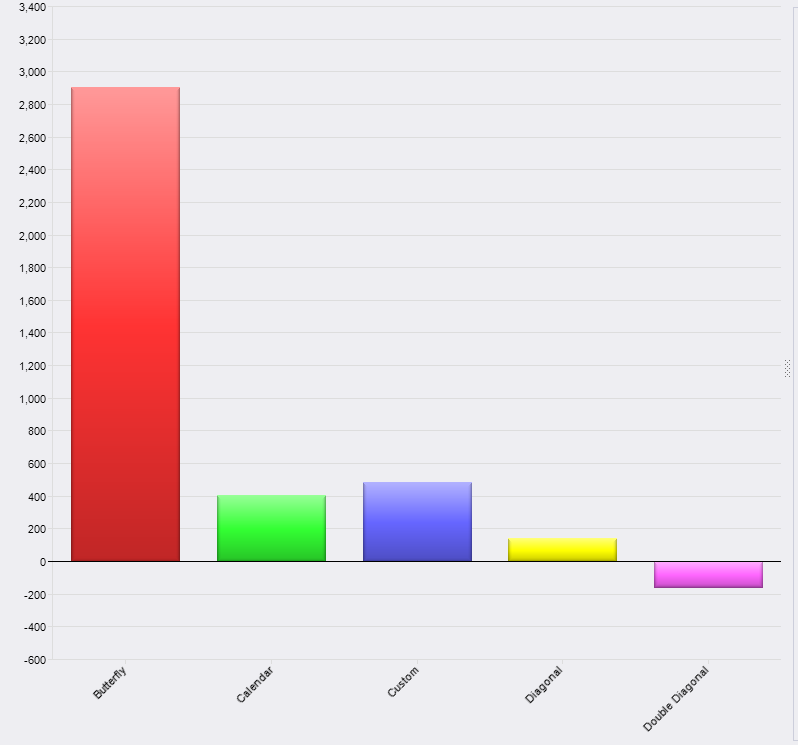
So I think I did pretty well all things considered this year, but I still didn’t quite make my mid-year goal. I was $1,768 short. This shortfall came down to two bad trades. One is forgivable as I was experimenting with short-term GLD calendars. I ended up taking a loss of $607 (48%). It was around this time that I started questioning doing these trades. I ended up doing 2 more and then stopped after losing around $180 more. I say it’s forgivable because I was working on finding trades I wanted to do when SPX wasn’t in a good place with respect to volatility. I had some success with the trade, but ultimately lost more than I made as seen here:
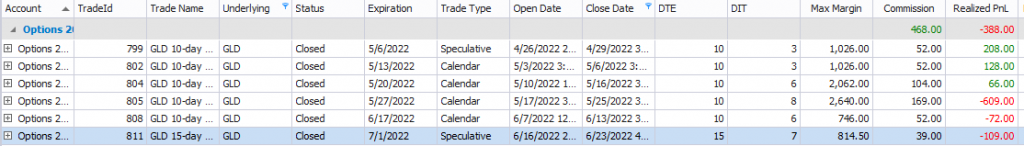
GLD Calendars during 1H 2022
So that was ultimately a $390 lesson. Not too bad when it comes to trading, however not taking quite as much of a loss on that big one would have definitely helped.
I also let one SPX trade get out of hand. I over-adjusted a 21-day butterfly and took a bad loss of $1,153 (45%). This is not acceptable. To avoid doing that in the future, I am being more strict as to how many times I adjust my trades and I started going out further in time on my butterflies. After that trade I opened flies from 30-35 days instead of 21-25 days. Having time in a trade is helpful when you are trying to repair it. This trade led me back to my Mantra of “Pets vs Cattle“. Feel free to read the post for the details but, in short, it means that I can’t get too attached to a trade. Some losing trades are worth just letting go. This is something I have struggled with as I learn this craft, but I think many traders do as well.
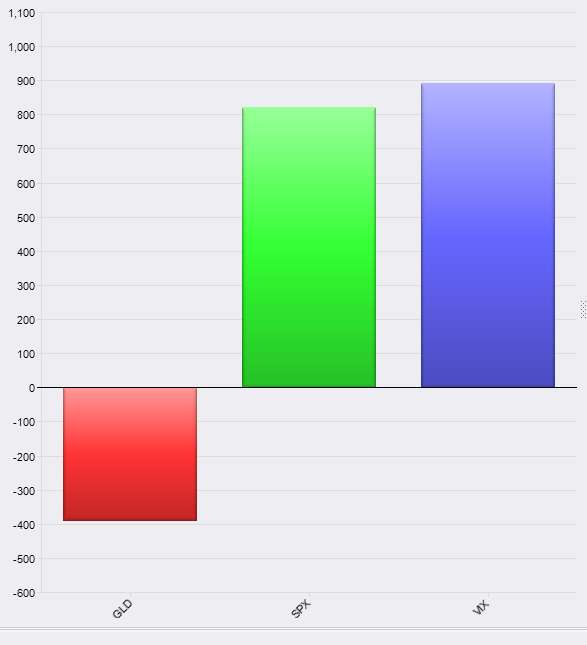
So this is how I saw the first half of 2022. Overall, it was a good six months with some very good trades. I did some experiments with respect to trading when SPX isn’t a good underlying. The VIX verticals did well, the GLD calendars did not. I think it’s possible to make up ground in the second half, but I need to stay the course and better execute my trade plans.
As usual, let me know what you think. I always like hearing from readers and viewers.
This content is free to use and copy with attribution under a creative commons license.