4 Changes That Made Me A Better Trader In 2026
This year has been a very good year so far. I've seen some traders get frustrated with 2025 and 2026 because this has not been a normal market. Things are moving back and forth many times against a lot of conventional wisdom. We've got another tech bubble going on due to the AI craze, interest rates, while not historically high, have been held high based on the last couple of decades yet we keep hitting all time highs. And, of course, there's chaos in the middle east wreaking havoc with oil prices with news reports all over the place that is moving the market. Yet, in all of this chaos, it is possible to make money trading this market. Keep in mind that I primarily trade SPX in a non-directional manner so much of what I discuss here will be in that context. But some of these idea may help you in your trading regardless. I made most of these changes mid-2025 and by August I started seeing some results which have continued so far into 2026. I'll have my fist half of 2026 review in a few weeks right here on the site. The early part of 2025 was an absolute mess and that made me really look at what I was doing and think about what changes I had to make. This is why I do all of these trade reviews, both with the weekly videos and the half year reviews here on the blog. But enough of that, let's talk about the changes I made and why I think they are working.
I Changed The Way I Look at IV (VIX)
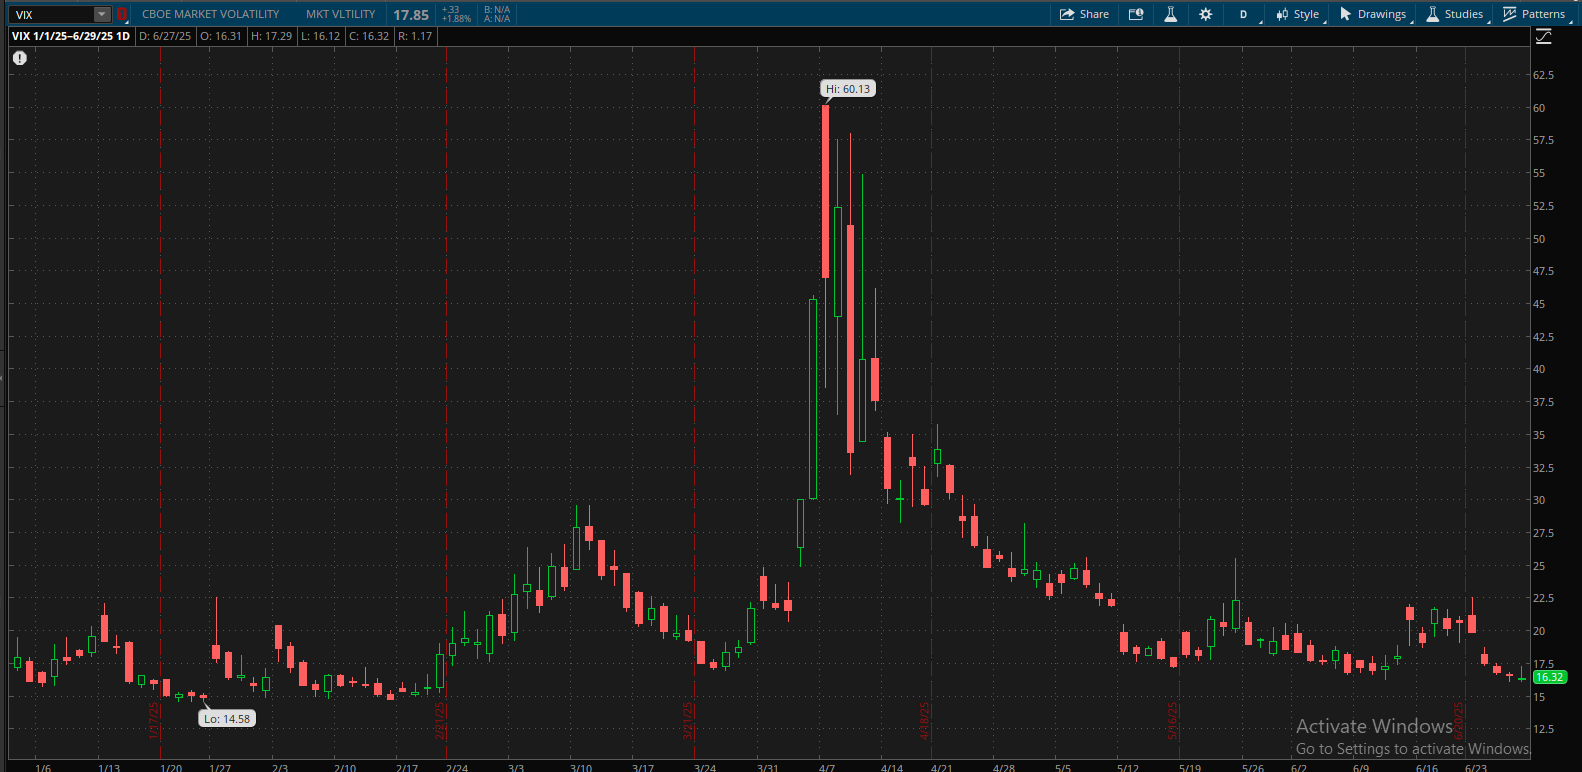
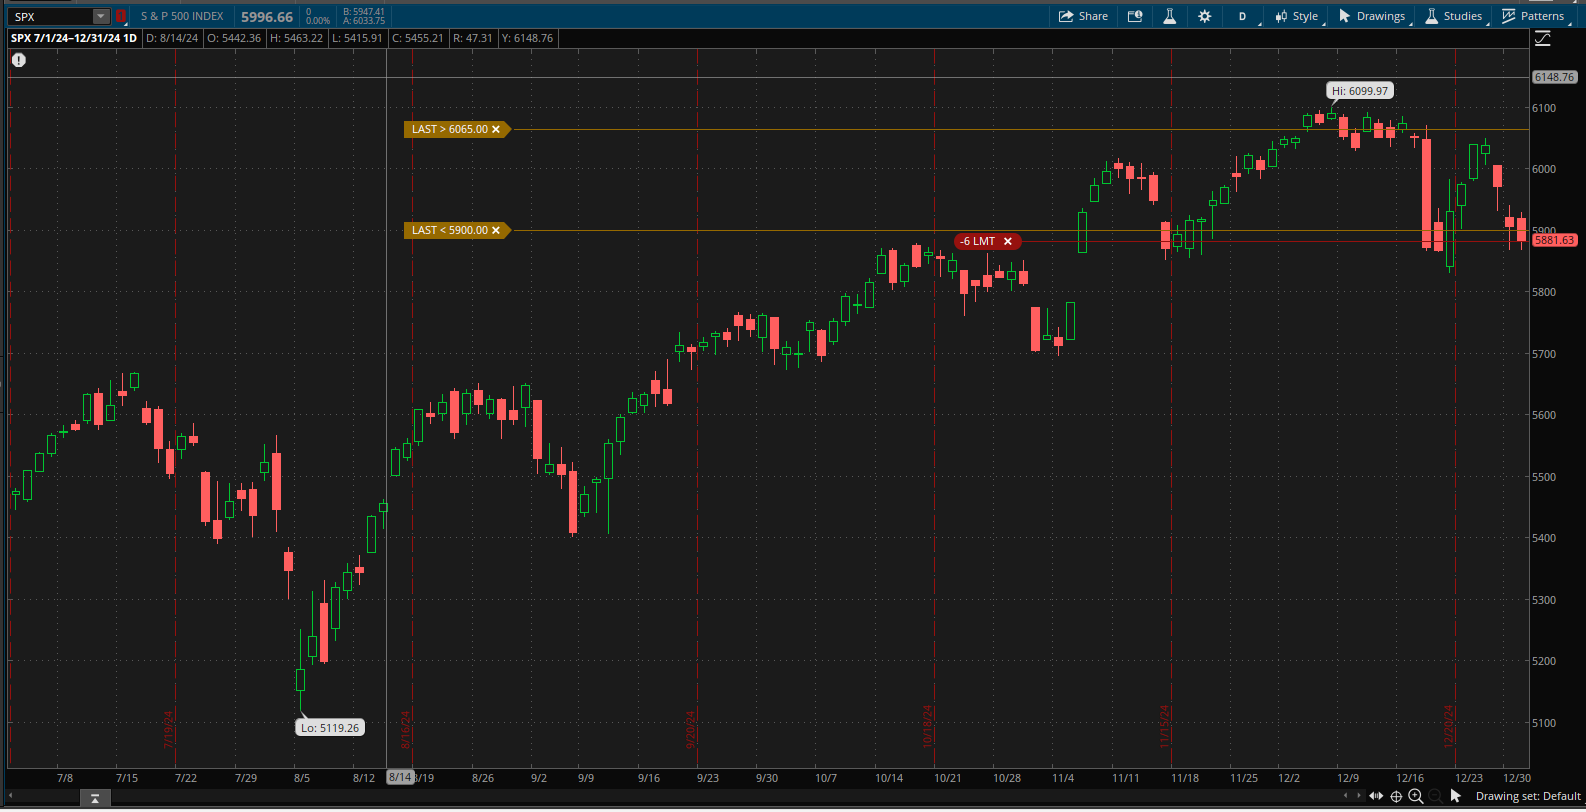
Because I'm an SPX trader, VIX is a reasonable proxy for the IV of the index. I use it as tool to determine what kind of trade I want to enter. When VIX is low, I tend to go long Vega (think calendars, diagonals) and when it's high I like to be short Vega (think Butterflies, which I prefer to Iron Condors.). I believe that IV is mean reverting so it makes sense to be a contrarian, especially when it's particularly high or low. I had levels that I used for years. Generally if VIX was below 16, I liked long Vega and above 17 I liked short Vega. In the middle was a trader's choice. But, as I said, in the first half of 2025 my trades just weren't working. And so I had to look at what I was putting on and I realized that the market had changed and the VIX levels I was using didn't make much sense. Take a look at this 2 year chart of VIX:
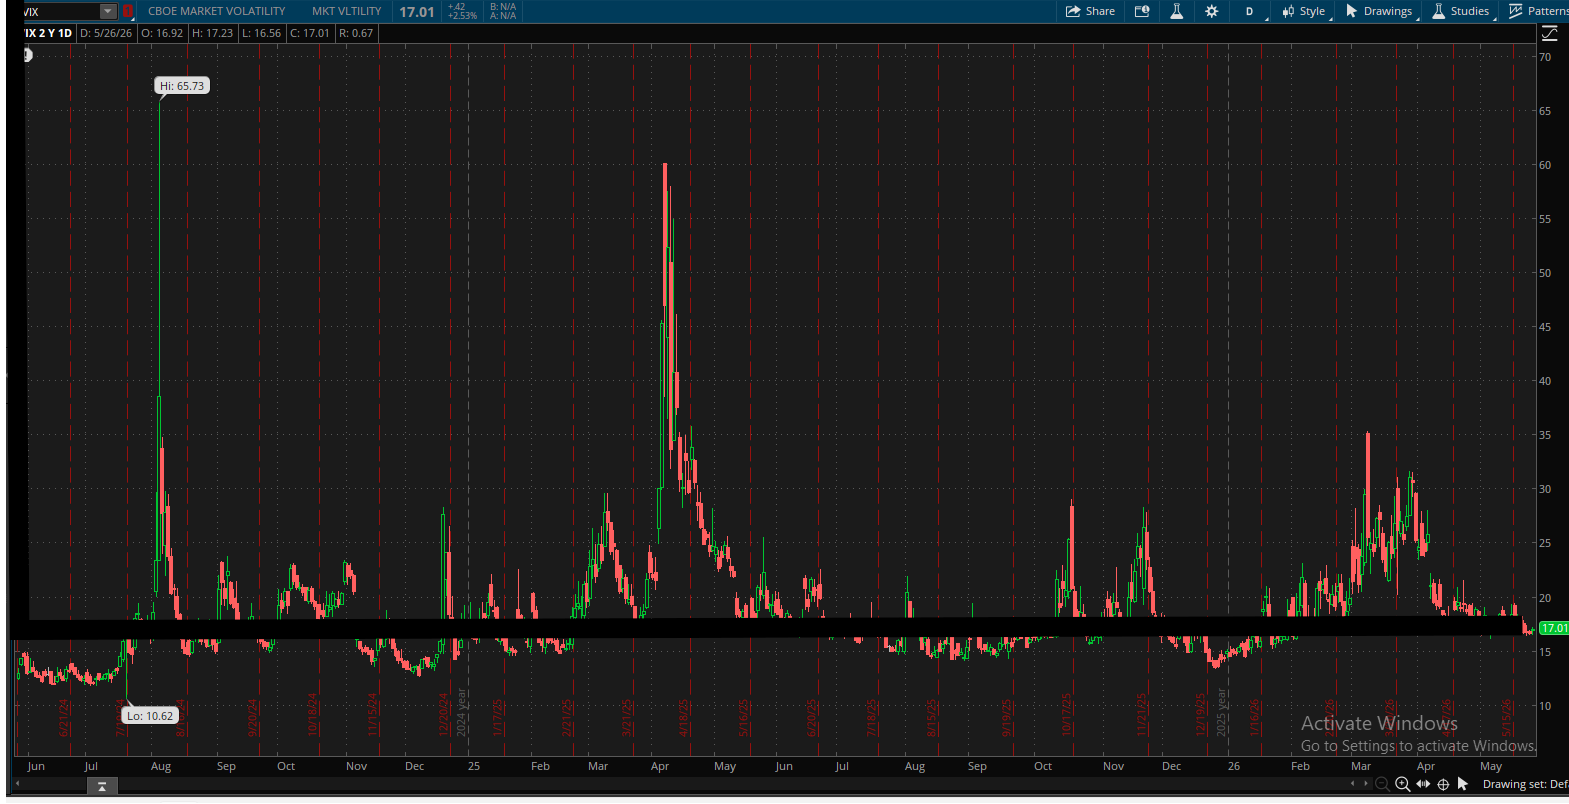
I know this image is a bit hard to read but the black bar across the image is VIX at 17 which is the point I'm trying to make. During the past 2 years, 17 is actually a low IV environment for SPX and so instead of being short Vega, I realized that being long Vega made more sense. Now I'll be long Vega until around a VIX of 24 or higher. Making this change helped me position myself with respect to IV much better and made my trading easier.
Since discovering that I regularly check VIX over a 6-12 month period to determine my levels. It's quite possible that the range will change again at some point and I need to watch for that change so I can change my initial trades accordingly.
Don't Be Afraid To Take Early Profits
With the market moving around in bigger chunks than before, there's nothing wrong with taking a profits early when the market offers them. In my early trading days I really held out to get at least 10% of my original risk on a trade. Today, I still get that sometimes, but I'm perfectly happy taking 8%, sometimes even less depending on the conditions such as:
- Time in the trade. If I can get 6 or 7 % in a day, I'm taking it. If I'm over 50% of the time in the trade, I likely just want to get out and move on.
- Known events. If there's a major market event (think CPI, FOMC, or a big earnings like NVDA), there's nothing wrong with taking a trade off before the event and re-entering after.
- At an Adjustment Point. More on adjusting later but, for now, if I'm at an adjustment point and I'm up any money at all, I just take it and move on. Sometimes I'll put on the same trade re-positioned based on the move.
Of course, you should try to make the risk worth the reward and sometimes staying in makes sense, especially if your Greeks are good and you are well positioned within the range. But, especially in strange moving markets, you can make good money with several small wins rather than trying to fight a trade to get a big win.
Keeping My Delta and Gamma Low
This came out of my end of year review of 2025 when I saw things getting better. What I realized is that, for me, around 3 weeks is a sweet spot for an initial entry into a trade. That doesn't mean I'm in the trade that long, I'm usually out in a week or less, but my most successful trades were around 3 weeks of initial duration. Why? Low Deltas and Gamma. When things start to move, having a low Delta and Gamma gives me time to react or gives me the patience to wait for a reversal. If I have a 4-lot calendar on (a very common trade for me these days), having less than 1 delta and 1 or 2 cents of gamma at the start of my trade has helped me ride of moves in the first couple of days in my trade when they are most vulnerable to big moves. When I was trading shorter term, one decent move in either direction and I would need to adjust only to watch is reverse and whipsaw me. Whipsaws can still happen, to be sure, but it's easier to be patient when the trade is 2% down with 2 deltas on a 4-lot, than 9% down with 5+ deltas on the same trade. I've coined the phrase “low deltas = low blood pressure”. In a market that is moving big on news events, having time in the trade is a great tool that everyone can do. Now if you're really good at 0DTE or other really short term trades, more power to you. But I have found, for me, that having some duration has made the way I trade more successful. That short term Theta looks really nice. But it typically comes with a lot of price risk. I prefer a bit more time.
Incremental Adjusting
This has been a game changer for me. When reviewing trades in the past I noticed that most of my unsuccessful or just bad trades all had one thing in common. Over-adjusting. In fact, I had a rule that I never wanted to adjust more than once in a day. And while I still rarely do that, I have since decided that I drew the wrong conclusion from that data. It wasn't as much the number of adjustments as it was the size of the adjustments I was making. I would crush my position Delta or, many times, reverse it. And that's fine as long as the market keeps moving in that direction. But when it would reverse I was right back in trouble and needed to back out the adjustment. I was, essentially chasing the market.
So mid last year I started making smaller adjustments. My main focus when adjusting is on the position deltas, namely, I want to reduce them (in absolute terms, I want to get closer to zero). What I found is that it's ok to do a small adjustment and then wait and see what the market does, then adjust more only if needed. Many years ago this would be expensive because brokers would charge you a fee per transaction plus commissions. That practice is, thankfully, long gone and so doing 2 small adjustments doesn't cost more than doing the equivalent move in one larger adjustment. I'll walk through a recent example.
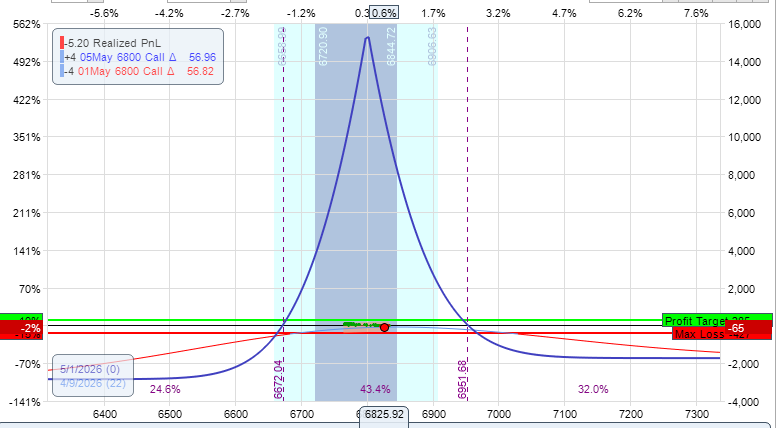
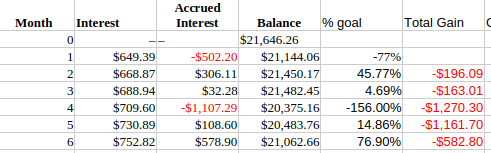
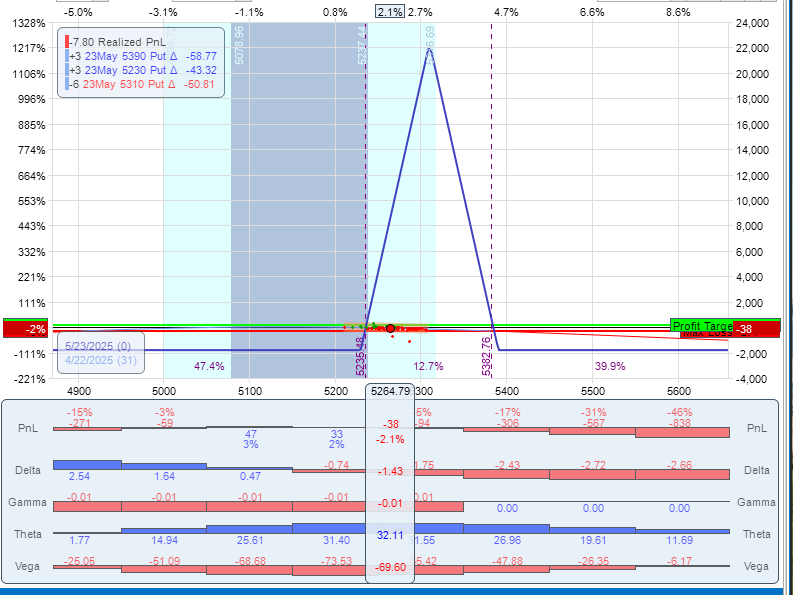
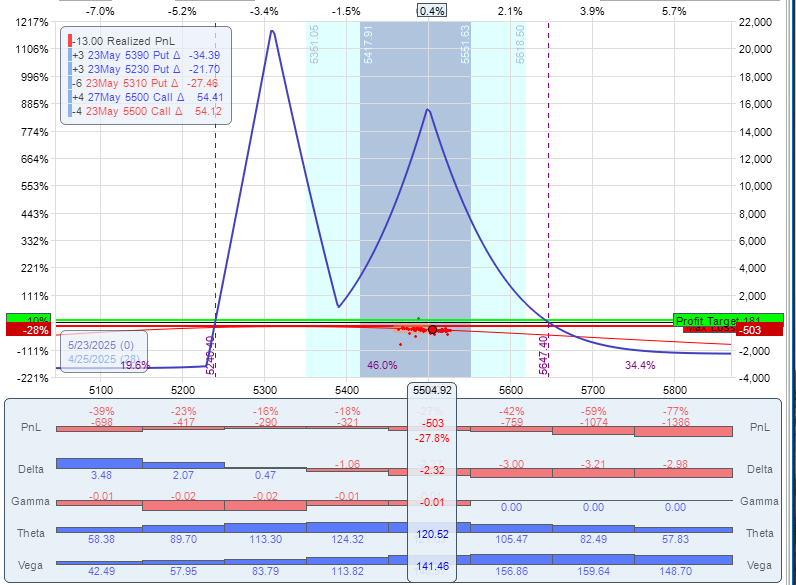
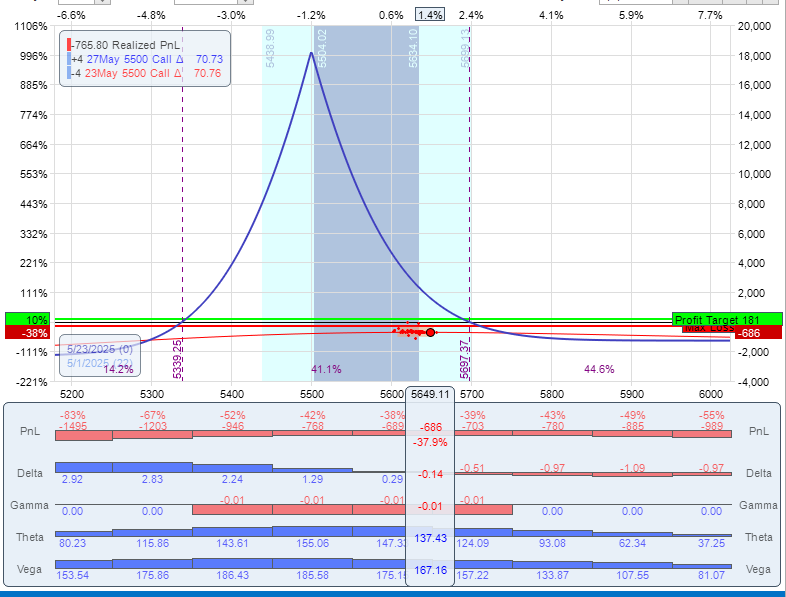
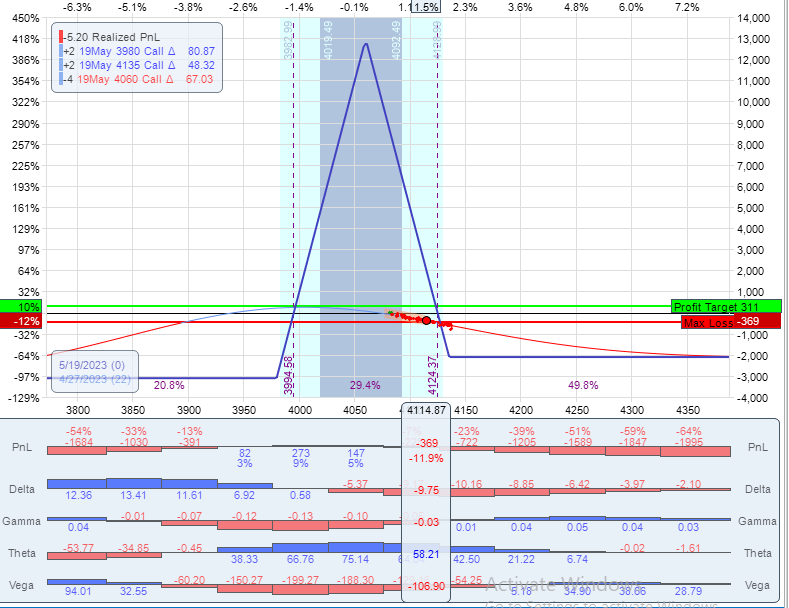
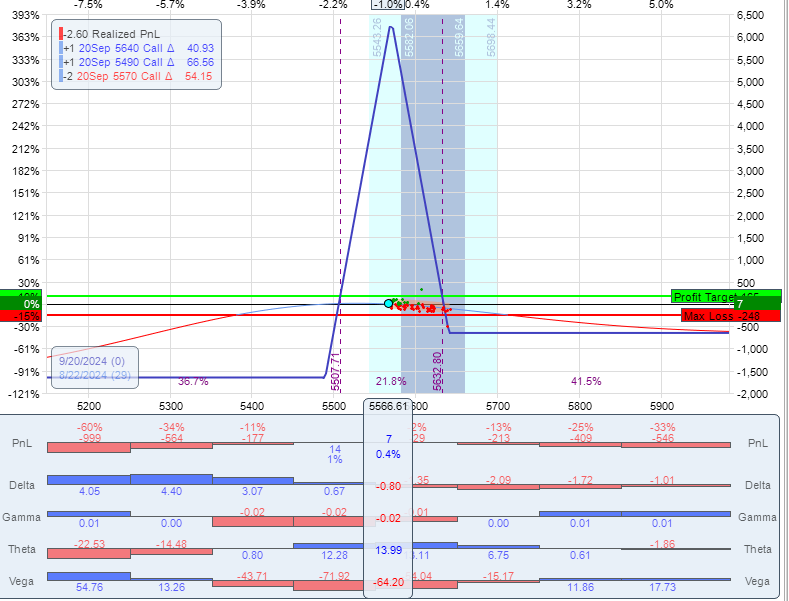
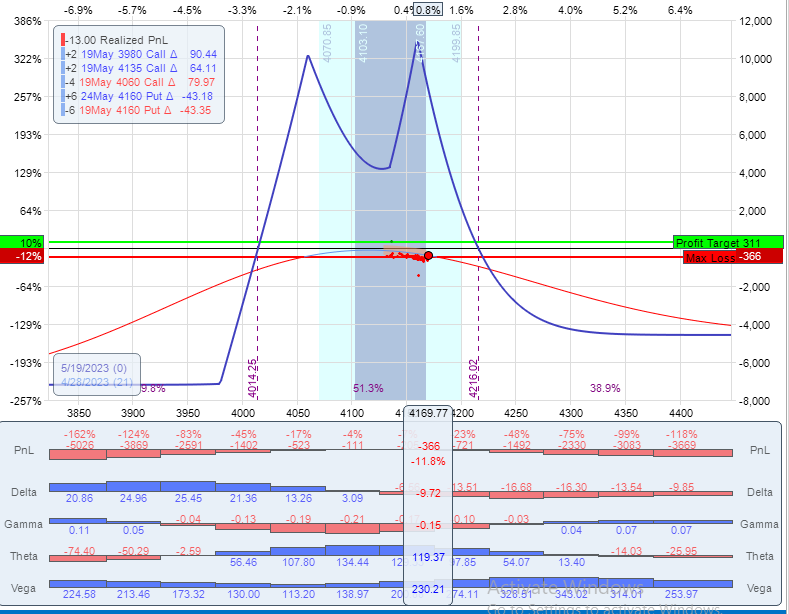
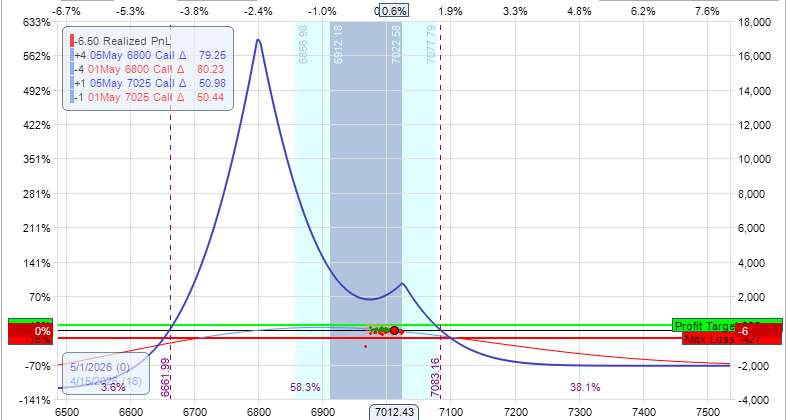
Back on April 9th I opened a 4-lot calendar about 25 points under the money at 6800 in the calls. The shorts were 22 days to expiration and the longs were 4 days later. VIX was about 19.58 when I entered it. So right now you can see I'm applying multiple principles here. I'm willing to be long Vega at this VIX level and I'm starting about 3 weeks out. This makes my starting position delta 0.55 on a 4-lot with 0.03 short gamma.
A few days later on April 14, we've been moving up and I'm approaching the high end of the calendar tent. At this point I'm around 4% down in the trade and my position delta is about 2.80 short.
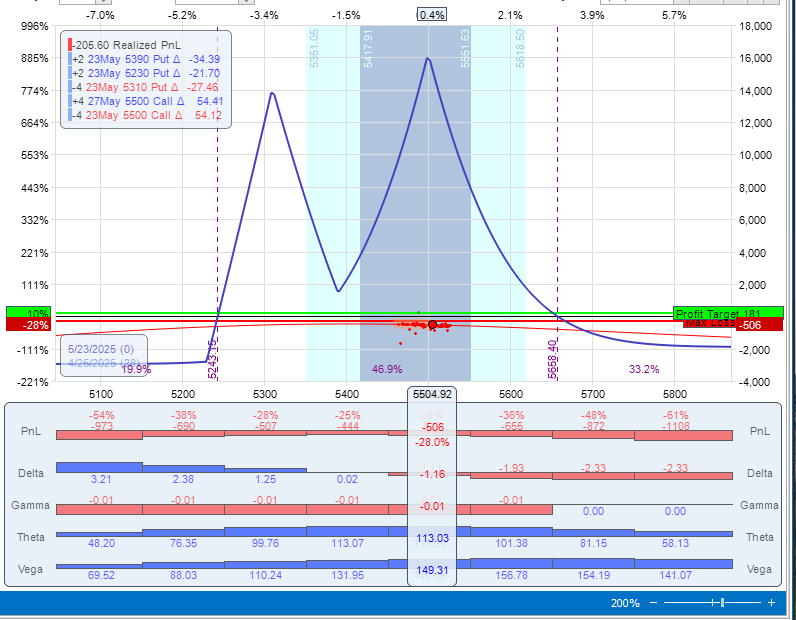
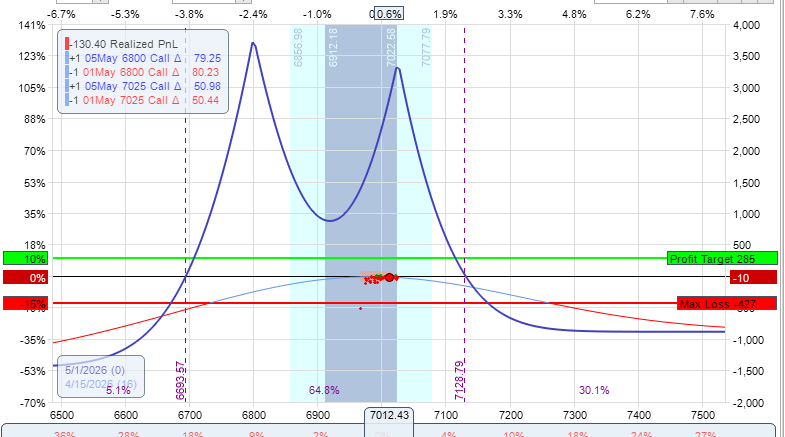
Note, this is about 12:30 in the afternoon (US Eastern time) so there's still a good bit of trading left to do today but I don't feel comfortable with this risk. Before I would add 4 calendars to the top to turn it into a balanced double calendar or, if I didn't want to add that much capital I would roll 2 of them up. But both of those trades at this point would really skew my position delta, remember I'm only about 2.8 short. So, instead I add 1 calendar at 7025C.
This adds decent room to the upside tent, but only cuts my position deltas down to about 1.75 short while adding about $500 to the trade. Now I have slowed down the bleeding on the upside but I still have some short delta if SPX reverses.
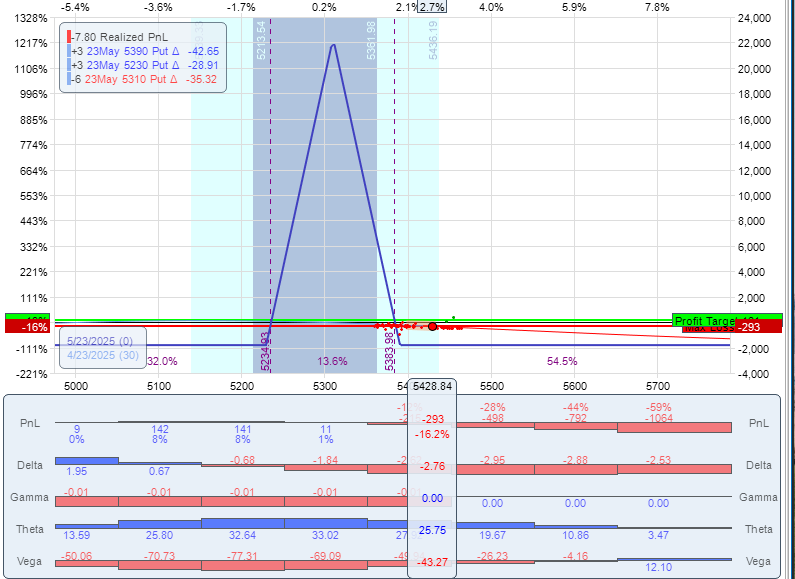
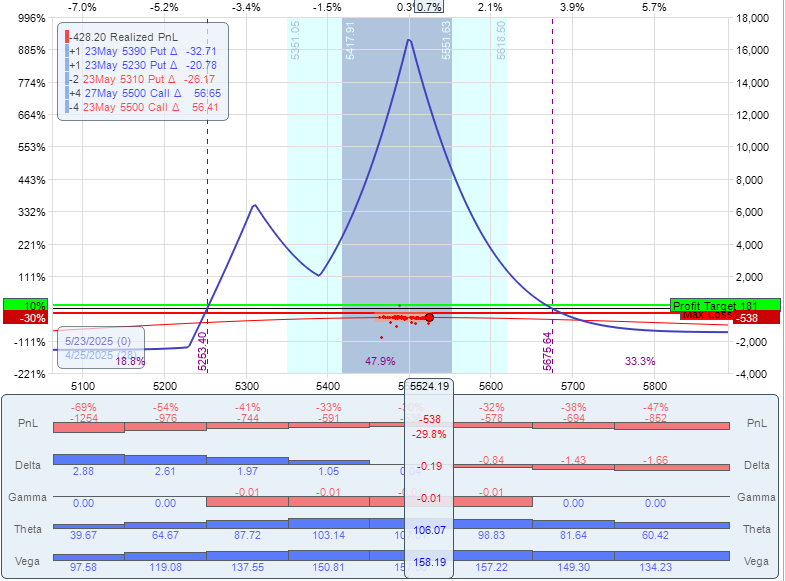
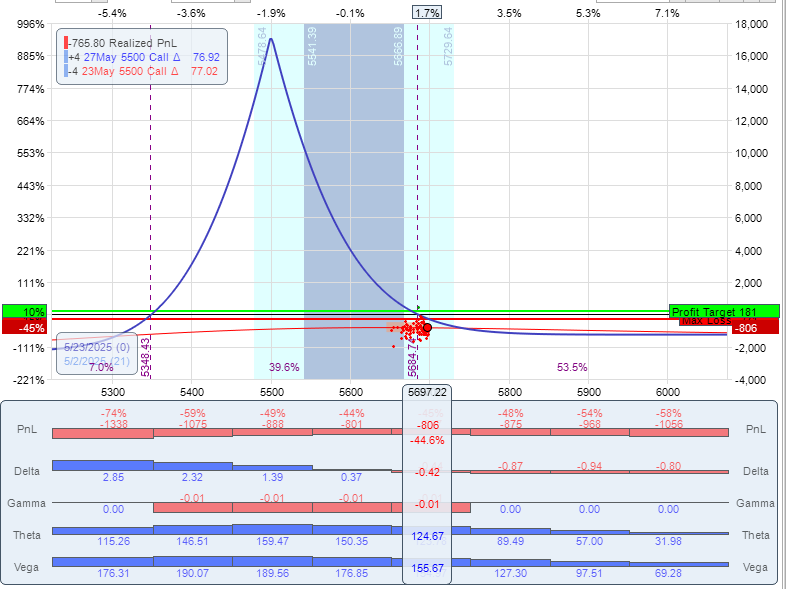
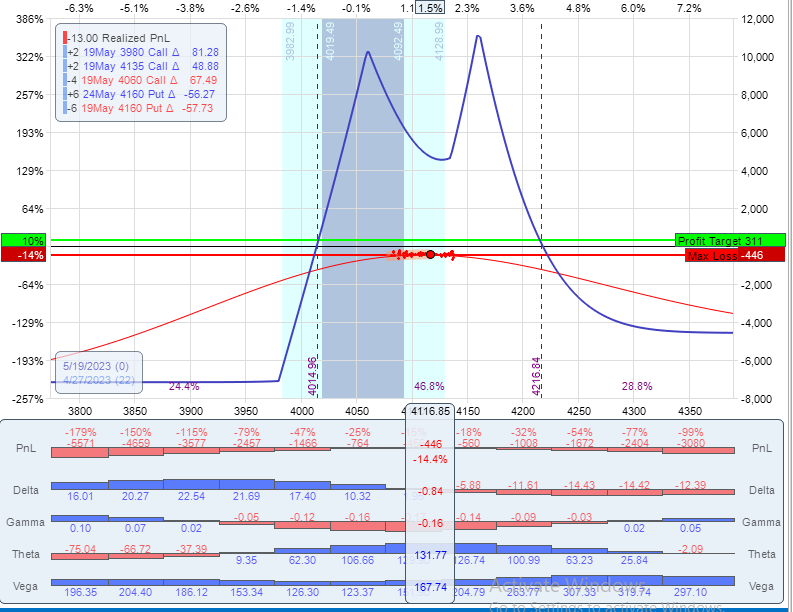
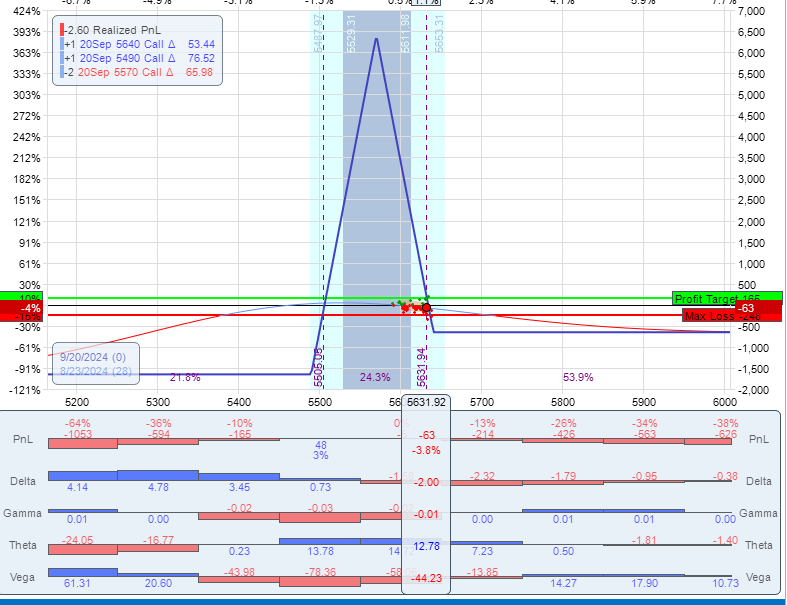
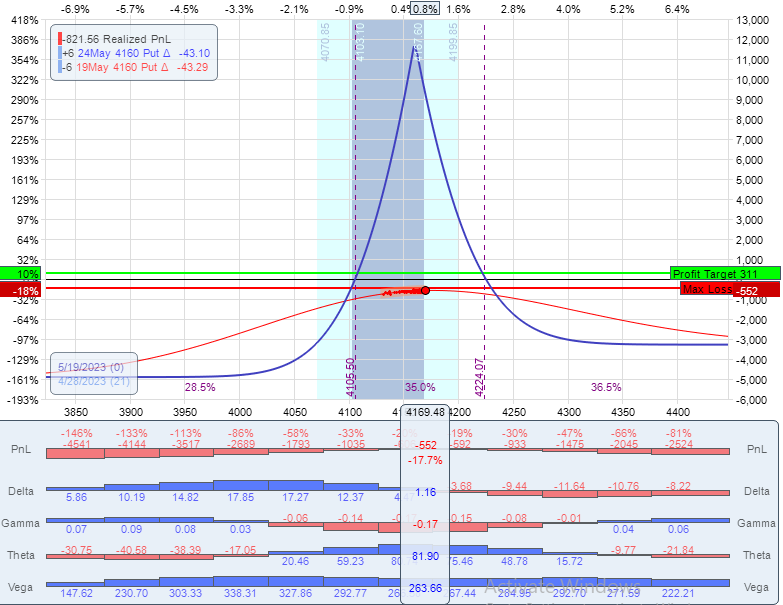
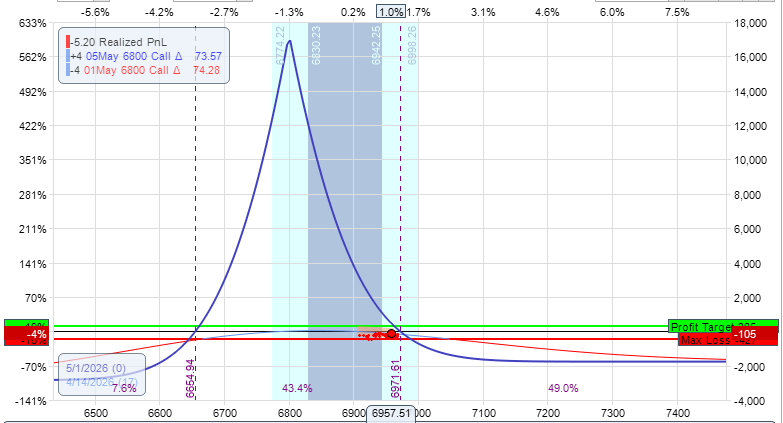
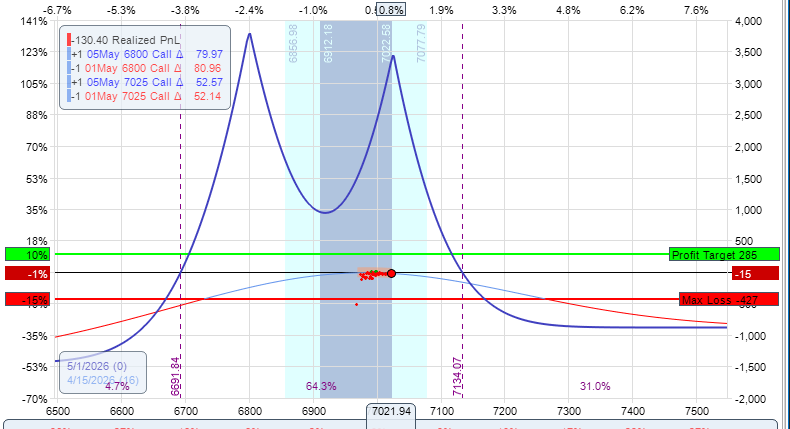
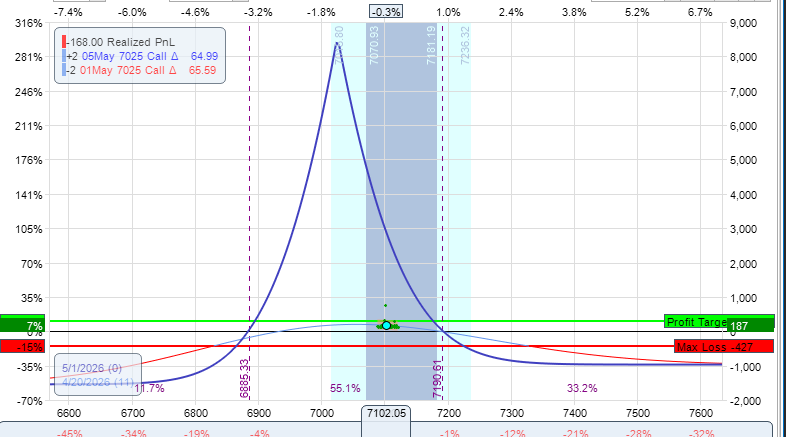
And the very next day, SPX is up almost another standard deviation to 7012 (remember I entered this trade when SPX was 6825 so this has been a decent move) and my trade now looks like this at around 2:40.
Would a bigger adjustment been better? Probably, but there's no way to know that, but I did make it better on the trade by cutting the position delta the day before. But now the delta is 3.38 short and the P/L isn't changed that much. But I'm about 15 points away from the center of the other calendar. The way I used to trade I would wait until SPX breached the center of the upper calendar, but that would require a bigger adjustment and I like being able to adjust earlier to just lower my delta risk. So in this case, I sold off 3 of the lower calendars leaving just a 1-lot double calendar. My thought at the time was that this would be the first step to exiting the trade as I didn't like it as much but by incrementally adjusting I gave myself some flexibility.
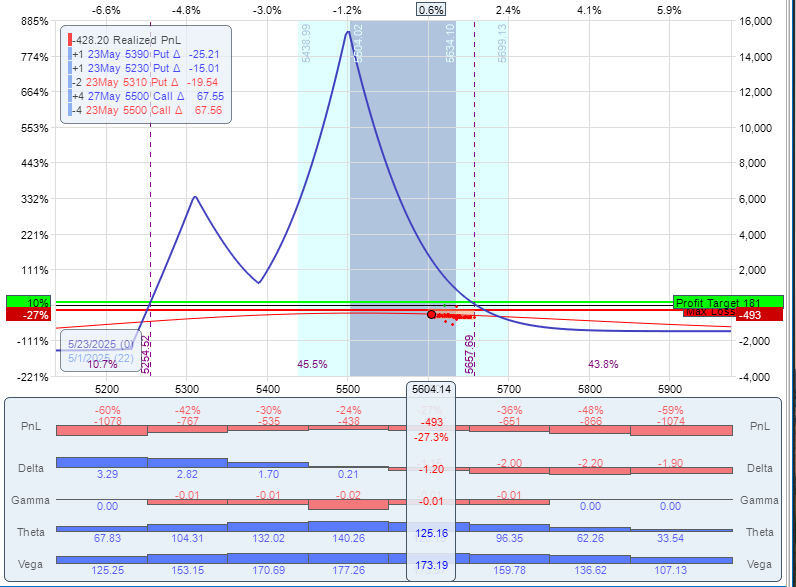
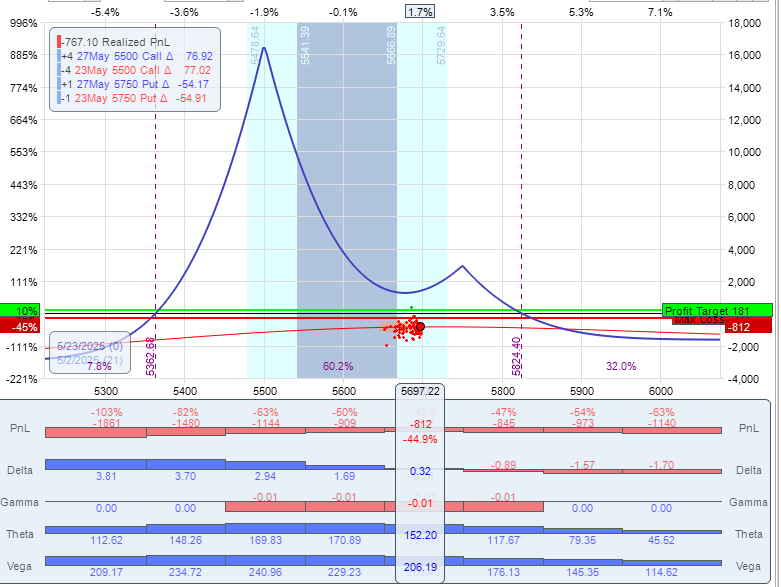
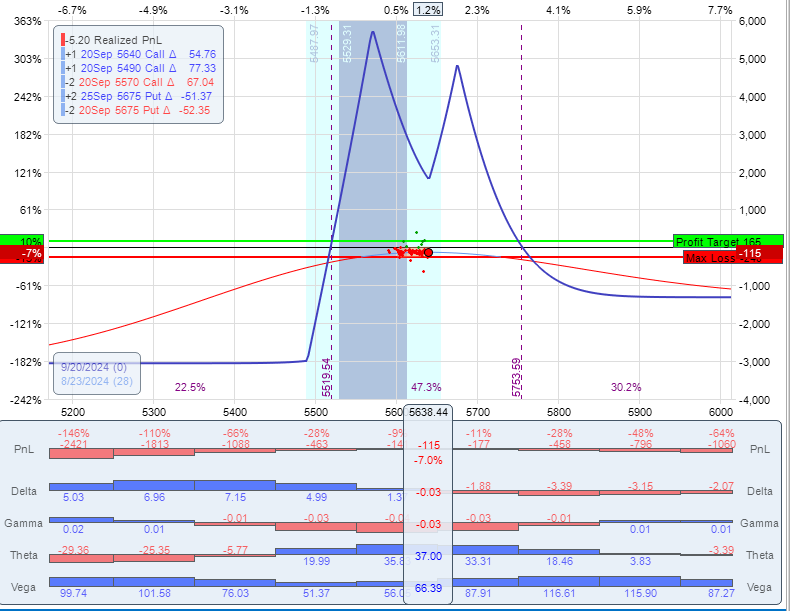
So now I have drastically cut my overall risk from $3400 down to $1400 and my position delta is now 0.44 short. Like I said above, I didn't like how the trade was going so I wanted to take some risk off the table all around and, possibly just take it off at near break even or even a loss.
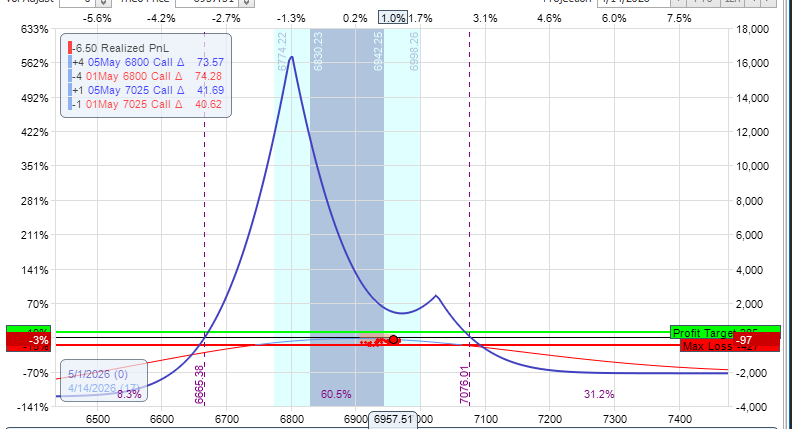
Later that same day, around 3:25, SPX basically hit the center of my upper calendar. My position deltas were still pretty low but I was still thinking about taking it down, but the more I looked at it, the more I started to think it wasn't as bad as I thought. So instead of taking it down, I rolled the lower calendars at 6800C to strikes of the upper calendars at 7025C. So it went from this:
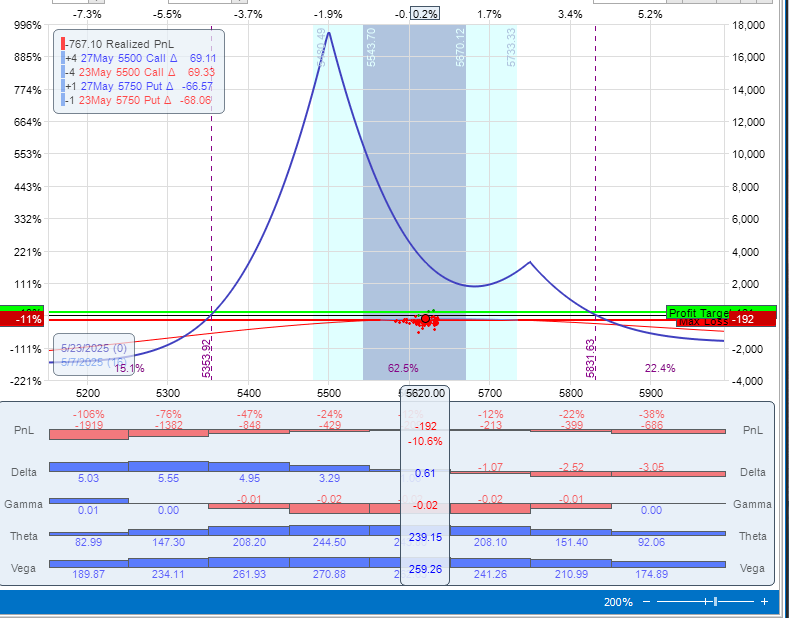
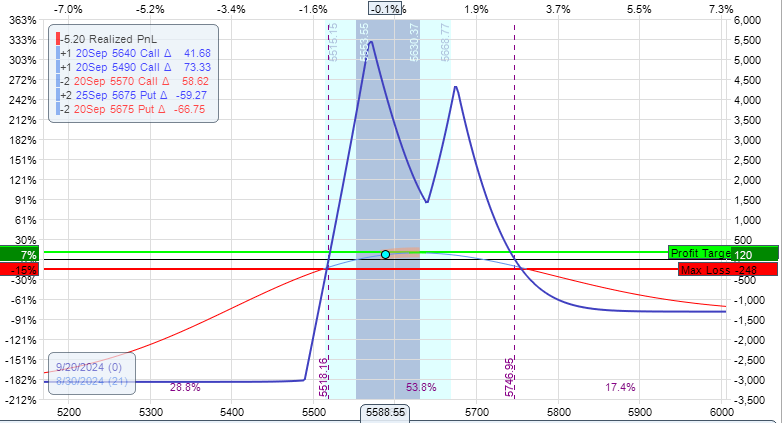
To this:
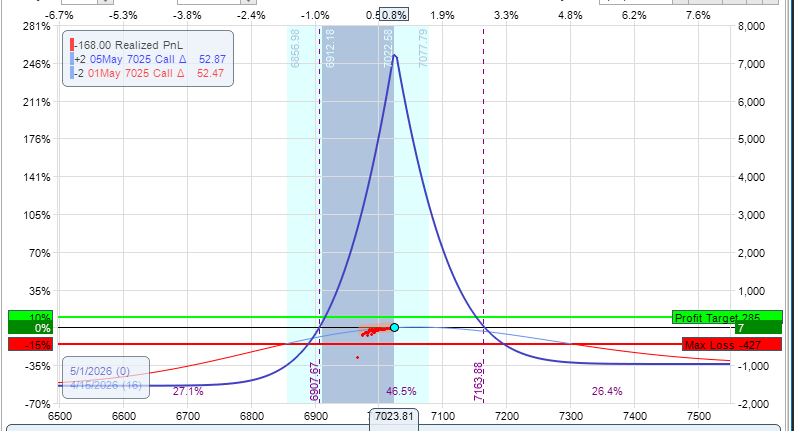
I basically reset the trade as a 2-lot calendar centered at 7025C. I did, technically, flip the sign on the position deltas which I usually don't do but it was pretty small anyway so I ended up with 0.80 long delta on a 2-lot. You might consider this just starting over and that's fine. I considered this a continuation of the original trade.
The market calmed down a bit after this (finally!) so I rode this out for a couple more days and on April 20 at around 3:30 I took off the calendars for about 6% of my original capital.
Now, is this the cure all for adjusting? Absolutely not. It is possible to over-adjust incrementally as well, but it is a tool and a mindset that has helped me handle trades that require adjusting better. Do I still take losses? Of course, but I'm avoiding bad losses by not over-adjusting and chasing trades.
Note that in this example, I used all 4 of these changes: I entered a long Vega trade when VIX was 19.5, I didn't hold out for 10%, or even 8%, I kept my position delta and gamma low, when adjustments were needed, I did small incremental adjustments.
I hope some of this helps you in your trading. So much of trading is a mindset and sometimes our mindset needs to change as market conditions change. The early part of 2025 was not a fun time for my trading. But what made it worth it was that I came out of it better.
This content is free to use and copy with attribution under a creative commons license.
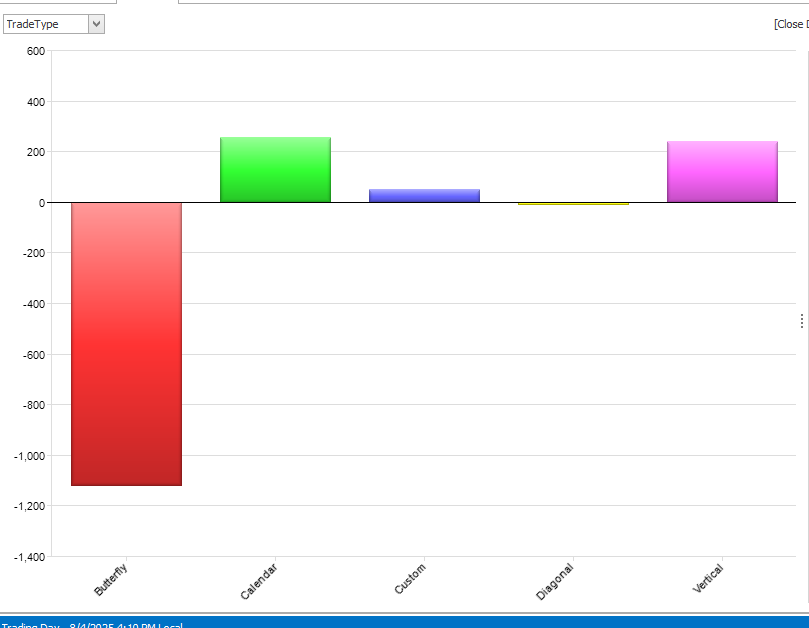
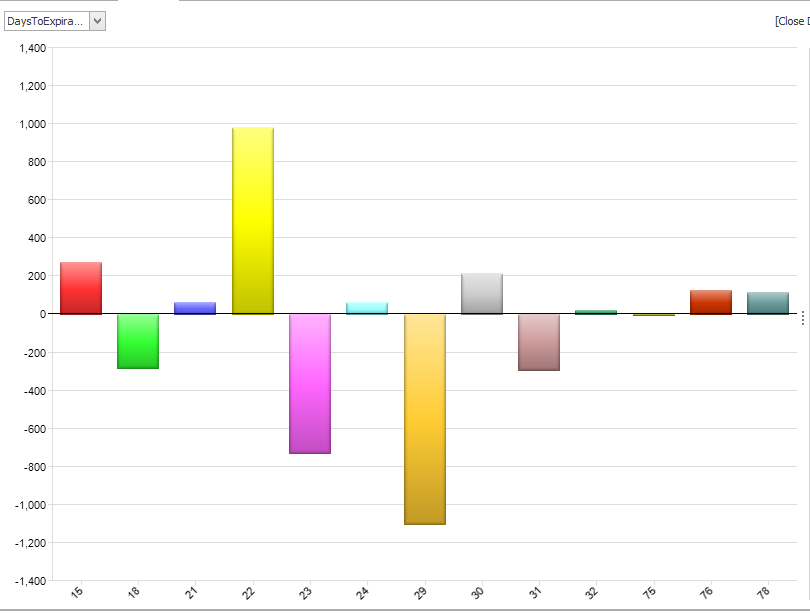
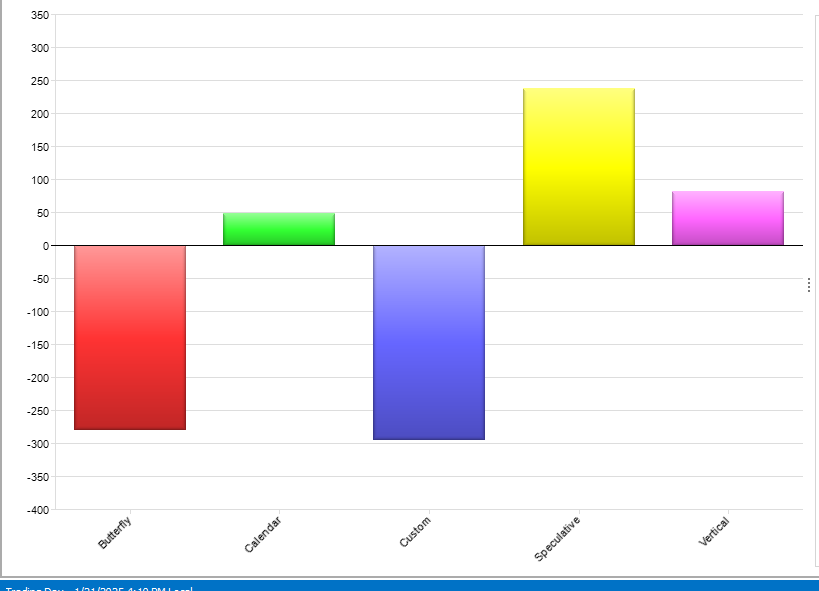
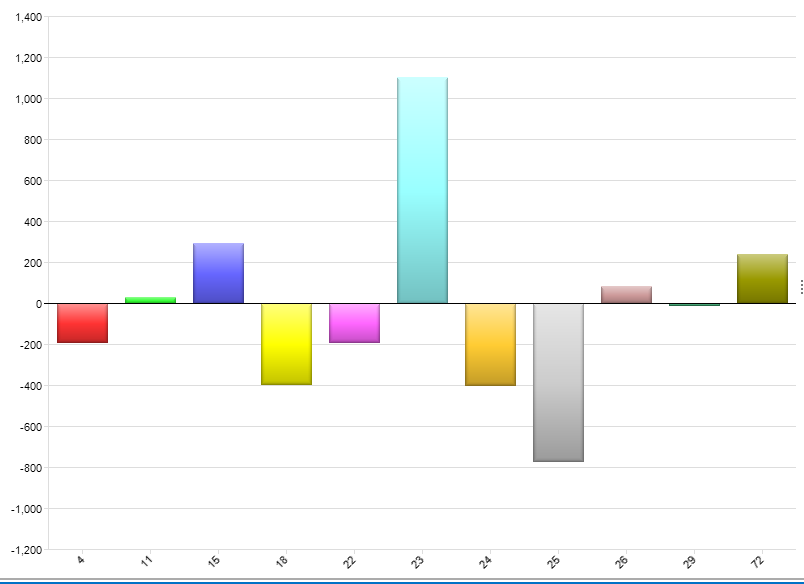
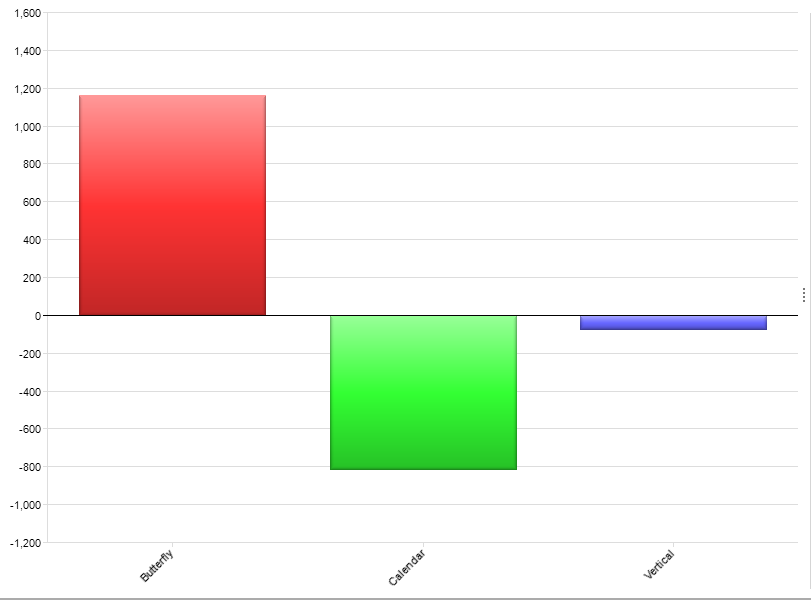
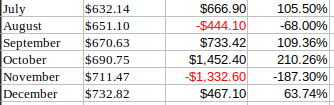
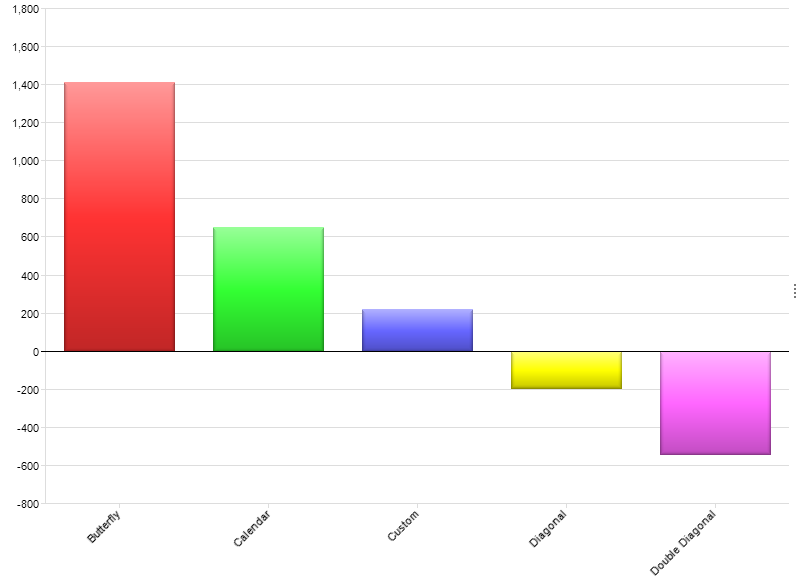
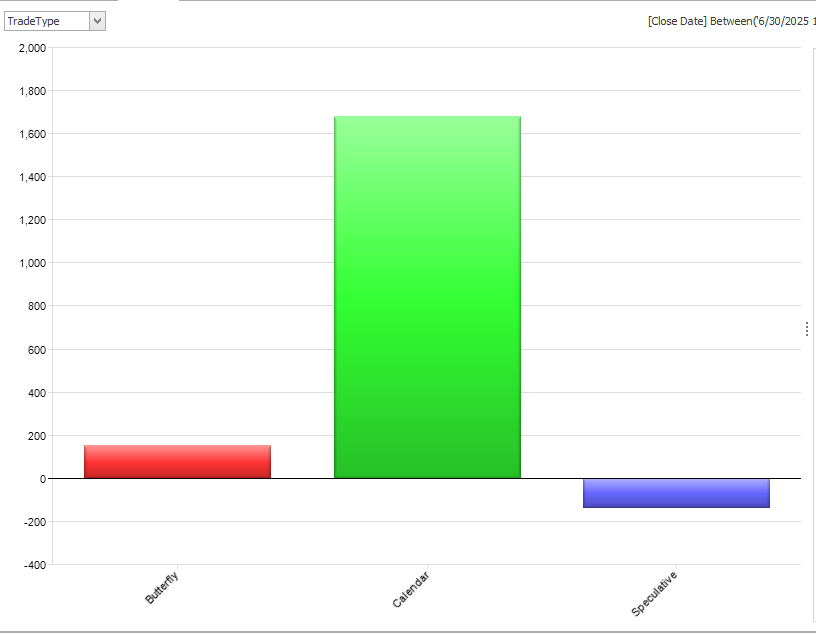 Obviously, calendars were the trade for the later half of the year, but this had more to do with the fact that I did so many more of them as implied volatility was lower than the first half and I traded much more long vega trades. The one speculative trade was a small earnings play in COST. I rarely do earnings plays and this is why...I'm not good at picking direction. I might do one again, but it will be rare.
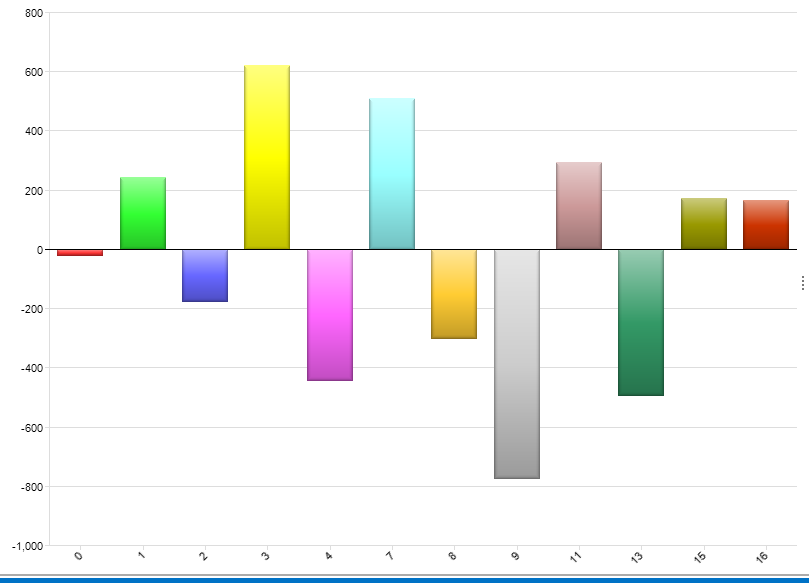
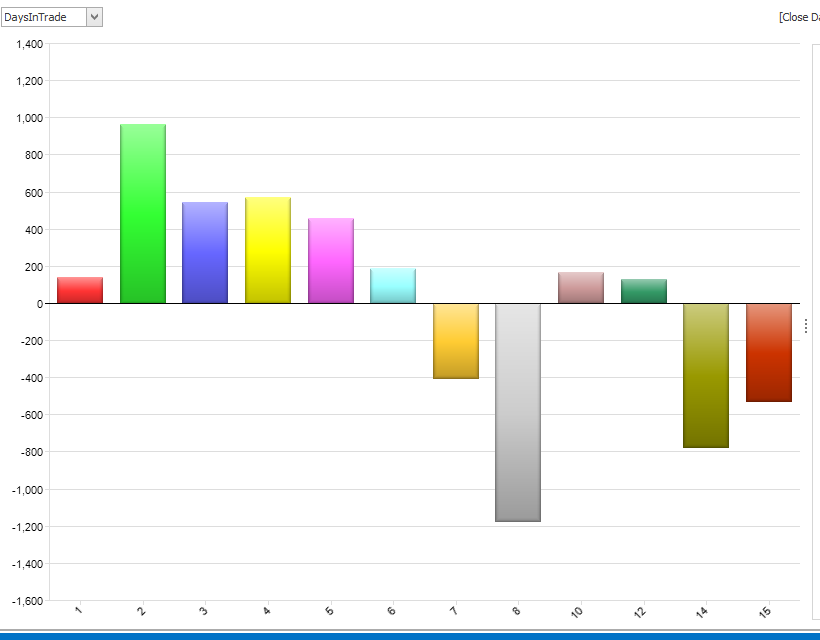
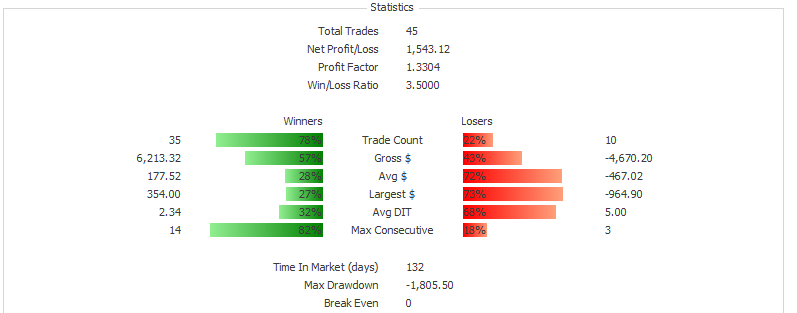
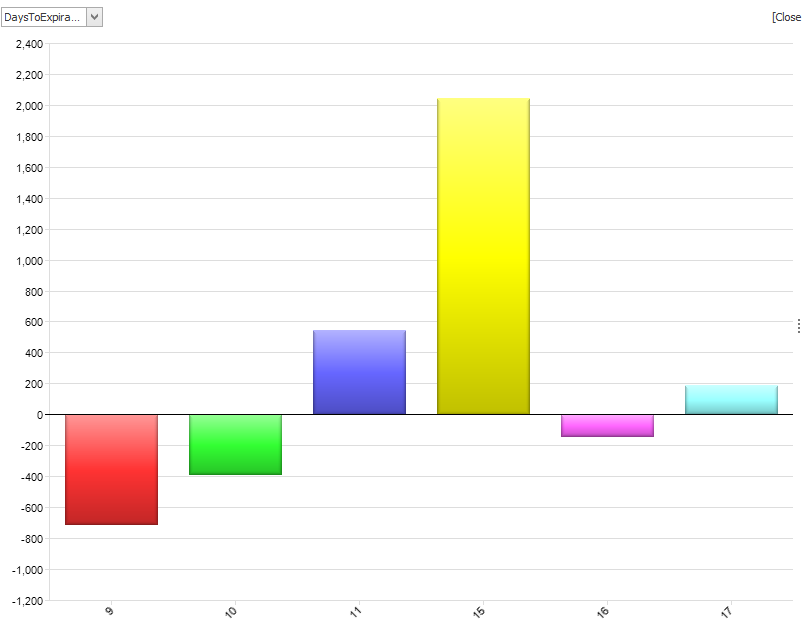
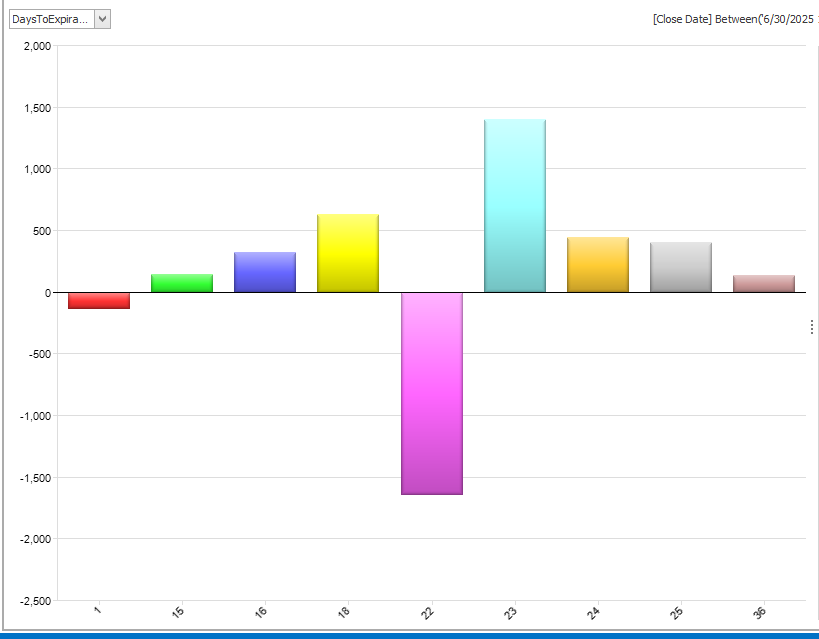 Overall all my DTEs worked ok. The 22-day stat is skewed a bit with the big loss at the end of the year. Most of my trades were between 18 and 24 days and that is where I am most comfortable. I decided at the end of last year to do fewer shorter term trades and I followed through with that in 2025.
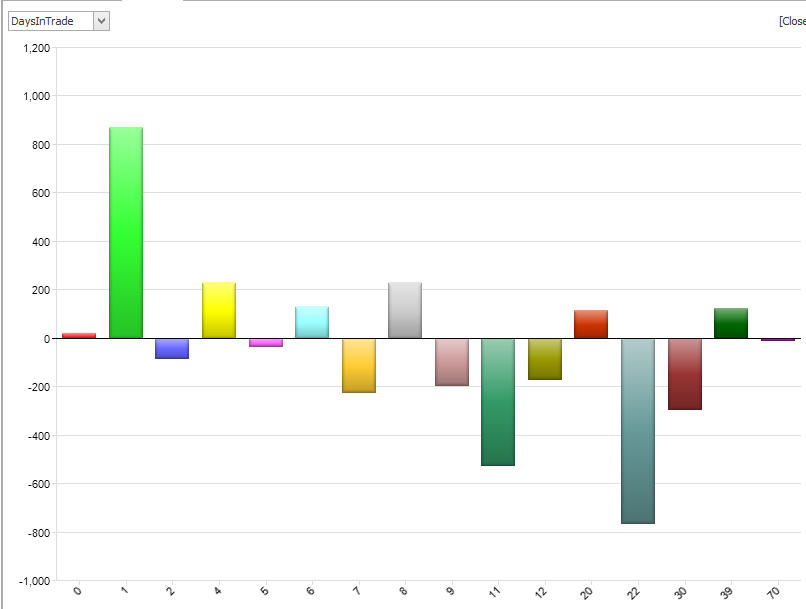
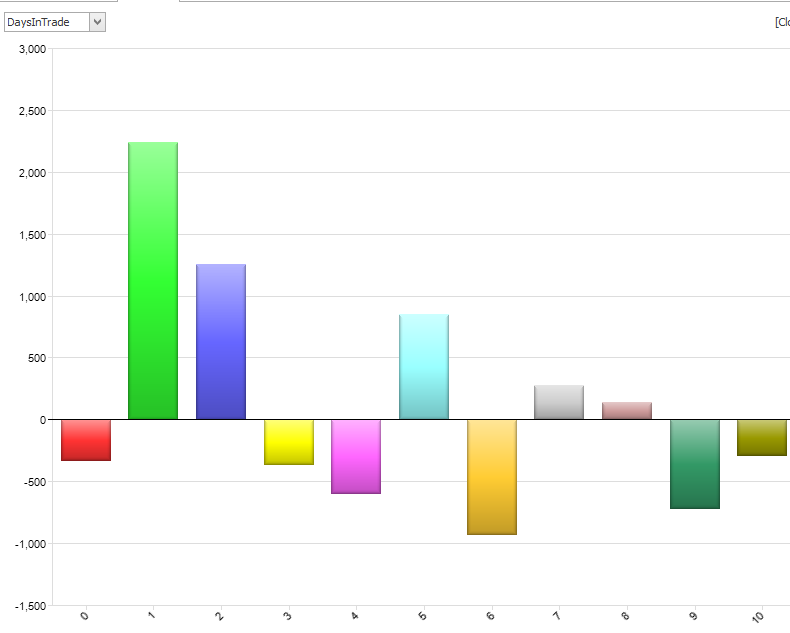
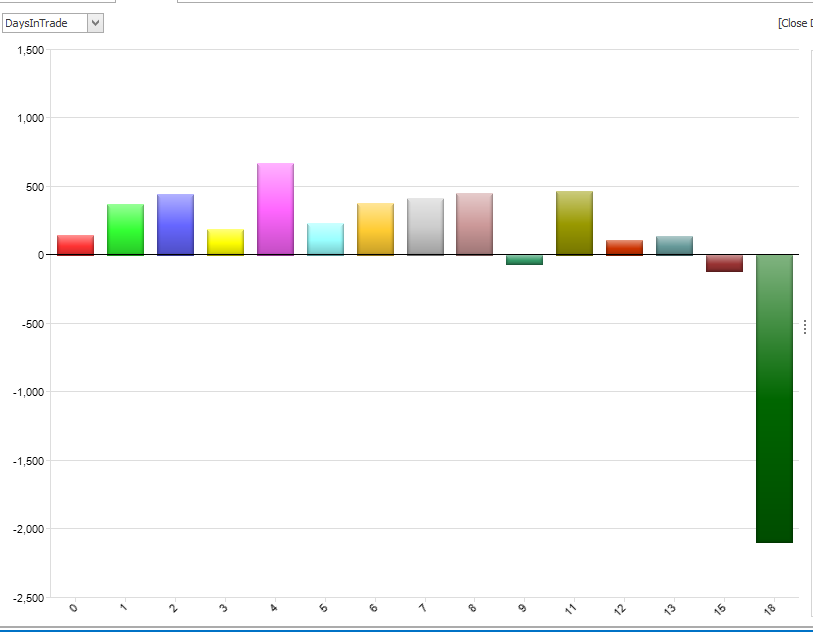 Again, this chart is skewed by the big loss at the end of the year. That being said, 10 days and less is the real sweet spot for my style of trading. At 10 days, I need to put the trade on a short leash.