Understanding Risk
Originally posted on November 28, 2021
I had a very good conversation with a reader recently. He is getting started in trading options and was looking for ideas with the S&P 500 (SPX/SPY). As that’s what I do almost exclusively, I was glad to hear his ideas and give my opinions on them. But the conversation really turned into a discussion about risk. He, as well as many newer traders, want to find ways to “play it safe” and minimize risk while still making money. Of course, it’s not just newer traders who want this. I think everyone would be happy with a low-risk strategy that makes money. The reality is that this business is a risk management business. We, as options traders, are paid to take on risk. That doesn’t mean we should take bad risks chasing high rewards, but we can’t entirely avoid risk either. But, more importantly, I think it’s important to understand the risks of a position or strategy. There are lots of different options plays out there each with different risk profiles. In addition to the contracts that make up the strategy is the element of time. And it’s easy to get drawn into a strategy that looks safer than it is. That’s not to say it is a bad strategy. There are times when most strategies are good plays. But it’s important to know the real-world risks of a strategy before deploying a significant amount of capital on it.
The Risks of Options
So, before talking about the risks of the trades he proposed, I think it’s worth talking about the risks of an options trade. One cannot define the risks of a trade without knowing the actual risks.
- Price risk is the one risk that most people understand as it’s similar to the stock world. The price of the underlying defines the intrinsic value of a contract. A contact that is in the money (ITM) has inherent value as opposed to an out the money (OTM) contract. Long calls and short puts benefit from a rising price in the underlying while Long puts and short calls benefit from a falling price in the underlying. These risks are estimated in the greeks delta and gamma.
- Time risk simply refers to the amount of time left in the contract. Time value is a component of the extrinsic value of a contract. Time value decreases as expiration approaches and it’s not linear. Rather it is doesn’t really start to move until around 45 days to expiration (DTE) and really is really moving in the last few days of the contract. Time risk is estimated by the greek theta.
- Volatility risk is, in my opinion, the least understood by new traders. But it is also a component of the extrinsic value of a contract and it quantifies the speed of price movement in the underlying. This one is tough because implied volatility (IV) is, well, implied which means it’s tough to measure until after a move has happened. But it’s important when thinking about the probability of a contract being profitable or not. And, to make matters more complicated, the value of that probability is derived from the live prices of the market. Because of that, it’s not entirely predictable. This could be a topic all to itself, but I’ll leave it here as a summary. Volatility risk is estimated by the greek vega.
Strategy: A Long Straddle
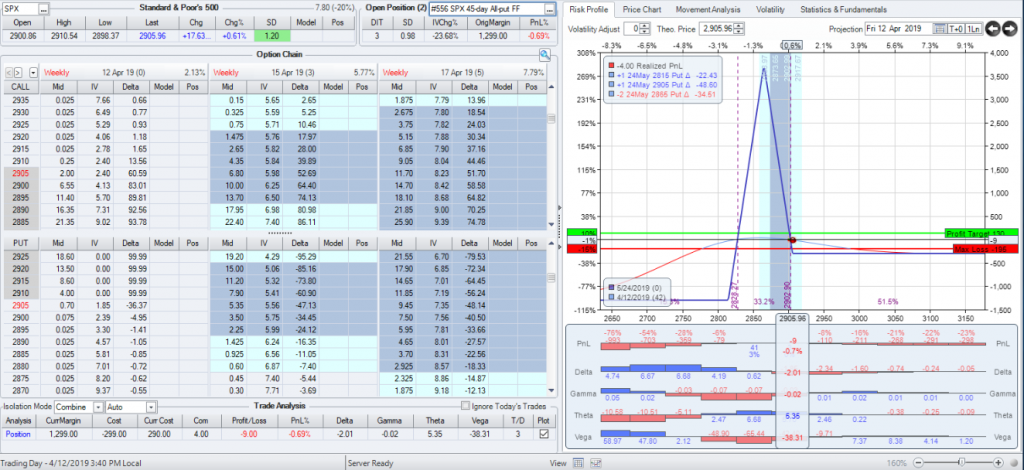
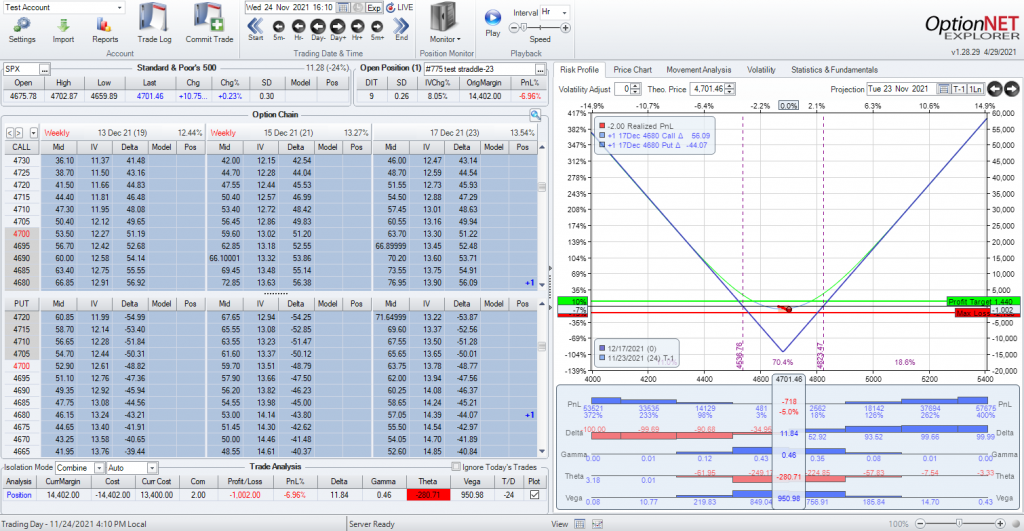
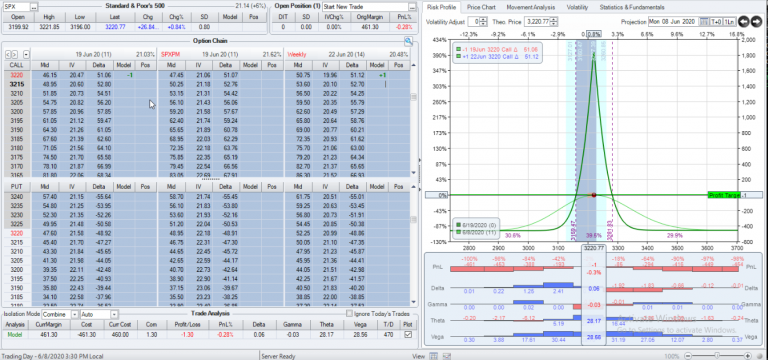
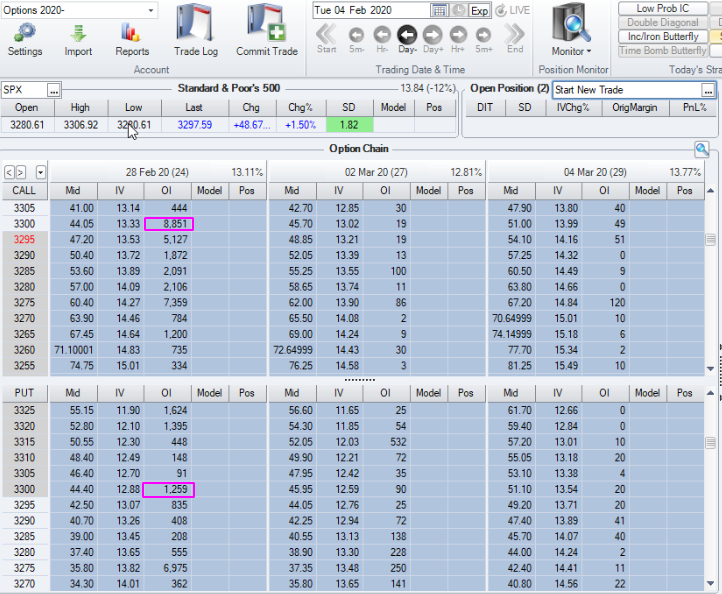
One idea that attracts new traders is the long straddle. In short, a long straddle is an equal number of long calls and long puts at the same strike price and the same expiration. An example of a 32-day long straddle is here:
A 32-day SPX long straddle
As you see, the long straddle makes money if the underlying moves in either direction since you own a long call and a long put. This trade as shown above is what it will look like when the trade is first opened. The graph looks safe..from a price risk point of view. If SPX moves down, the put side makes money, if it moves up, the call side makes money. You have minimized price risk. But the risk of the trade is if SPX stays range-bound and just moves back and forth in a series of normal days. In a long straddle, you don’t just need the price to move, you need it to move a lot in one direction. You need the winning side to make more than the losing side. This is where volatility risk comes into play. You need a large move in one direction. So perhaps you put this on before an event like earnings or you pick an underlying that tends to move a lot anyway. Well, everyone else in the market knows these things too and that will be reflected in the contract prices. If an underlying is reasonably expected to move during the life of the contract, the volatility component of the price of those contracts will be higher. This means your total price of the trade will be higher which, in turn, means you will need an even bigger move to be profitable since you have to make up the money you put into the trade. So you not only need a big move in a particular direction, you need an unexpected big move in a particular direction. And once the event is over, a good amount of that volatility can come out resulting in a “vol crush”. This lowers the price of your options (even the winning side) and can act as a headwind to your profits.
But it doesn’t end there, there’s still time risk. Because both legs of this straddle are long, both are negatively affected by time decay. This reduces the price of both contracts over time and acts as headwind to making money. So, you not only need a large unexpected move in a particular direction, you need it to happen as soon as possible because with each passing day, the hole gets a bit deeper.
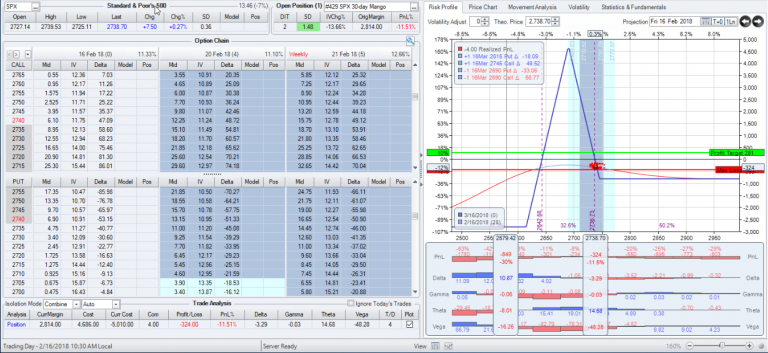
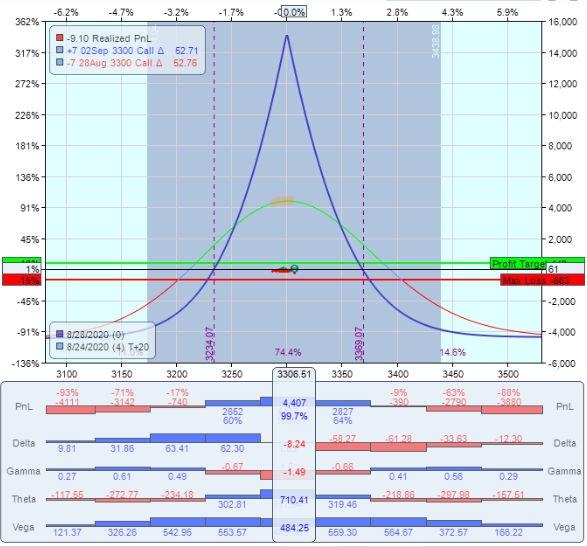
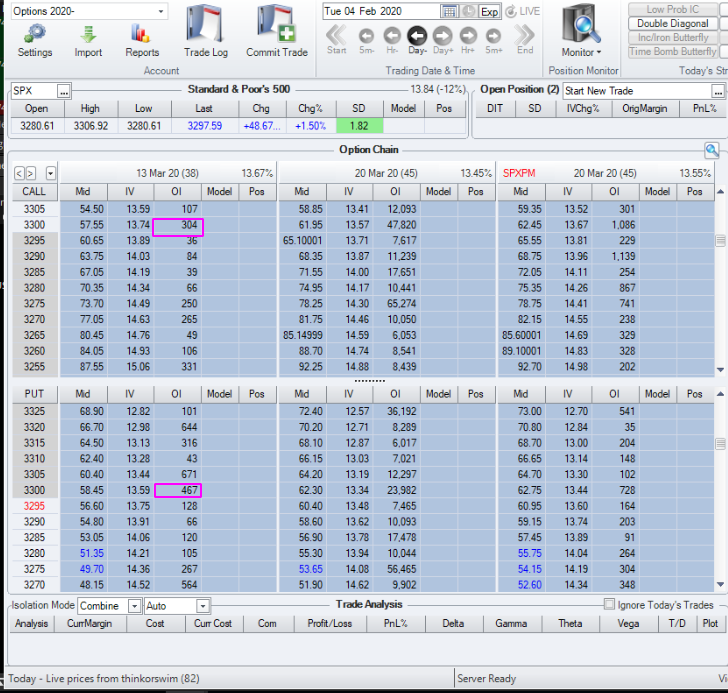
This past week we had a large one-day down move in SPX…106 points or 3 standard deviations. Just the kind of move you would want for a trade like this. Given that we put this trade on Nov 15 (11 days prior) here’s a graph of that same long straddle:
A 32-day straddle after a big move
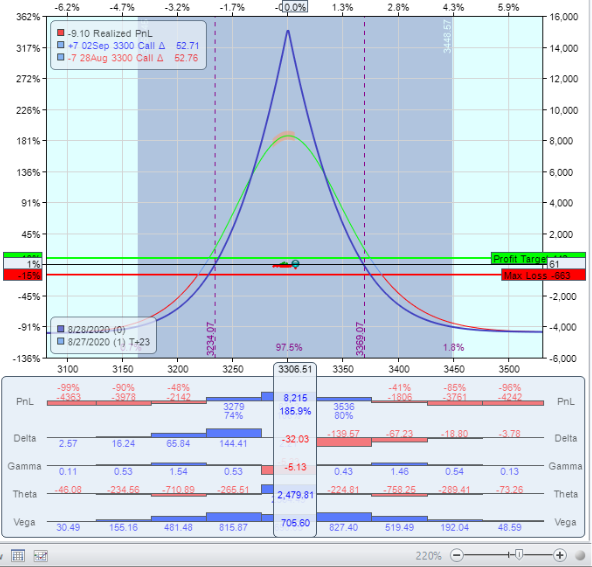
It’s making money to be sure, but it’s up 5.5%. That’s nothing to be mad about however, that’s after a one-day 3 SD move. These kind of moves don’t happen often…this is exactly what this trade needed, and the reward isn’t amazing for the rarity of the event. Part of this is the $200+ dollars of time decay in this trade every day. And what if that big move had not happened? Here’s that trade at the end of the previous trading day:
A 32-day straddle 9 days in with no big move
The trade was down 7% and it took a 3 SD move to get it to 5.5% up. I don’t think it’s a good strategy to count on a 3 SD move to make money on a regular basis. In this case, time and volatility risk can mask the lack of price risk to a new trader.
I’m not saying that a long straddle is a bad trade. If done at the right time, it can be quite profitable. But if your goal is a trade that will generate regular income, the odds of this trade stacked against you.
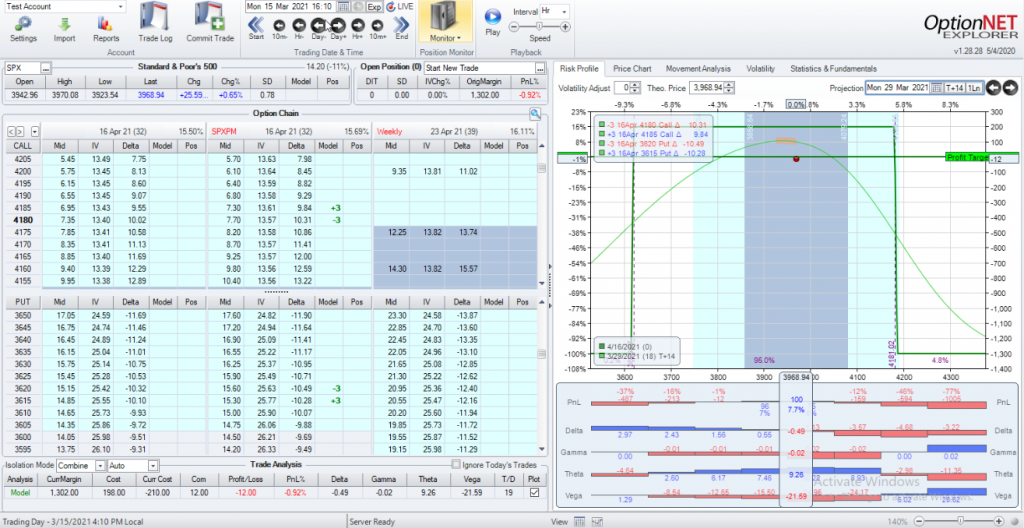
Strategy: Day Trading Calendars
So the next idea that was proposed was very short-term calendars. Now, anyone who follows my trades (which I post every week on this site) knows that calendars are one of my favorite trades. Very quickly, a calendar spread is selling contracts in a near term and buying an equal number of contracts at the same strike later in time. Because time will decay faster on the short contracts (since they have less time) the trade is positive theta so time works in favor of the trade (within a range). The idea was to day-trade calendars and try to skim off regular small profits and avoiding price risk by not holding the position overnight. Again, I see the appeal of this idea. In some ways, it is the opposite of the long straddle. Time is in your favor and not having a large move is also in your favor. You would lose in the case of a large move in one direction within a single day. So what don’t I like about this trade?
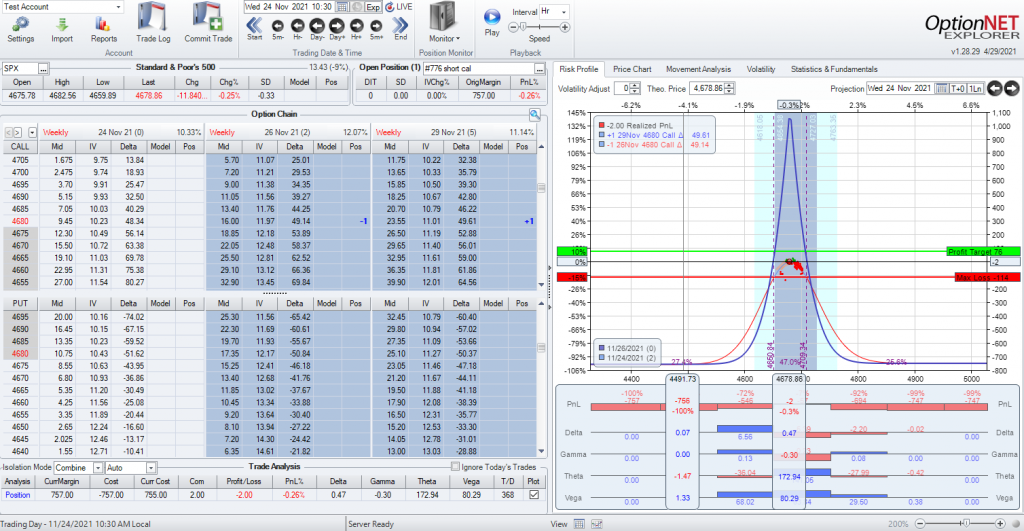
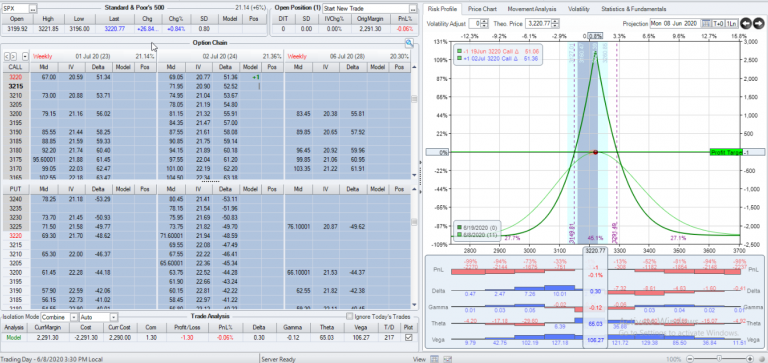
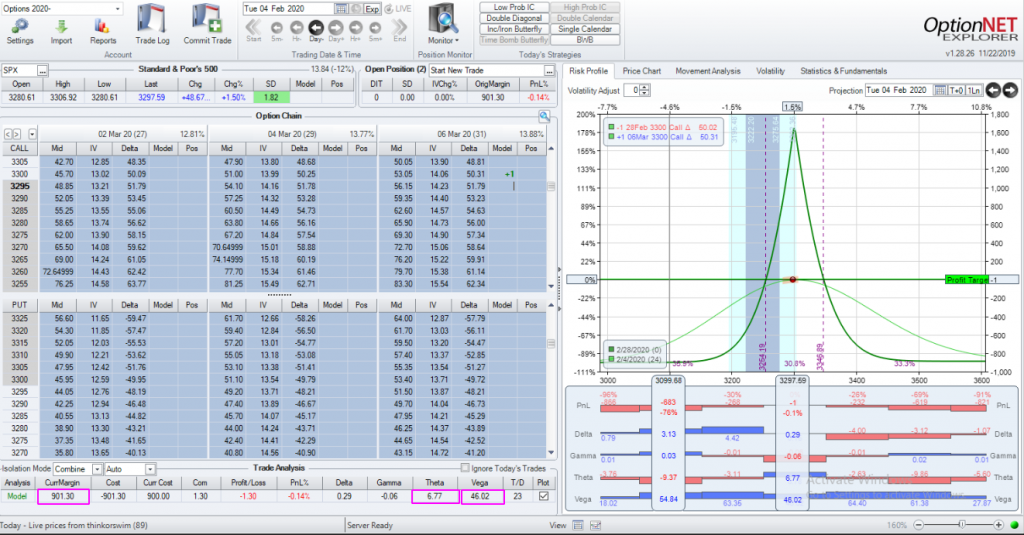
A 2-day SPX Calendar
At first glance this trade doesn’t look too bad considering the goal is to be out by the end of the day. Yes, the range is narrow but that’s because the shorts expire in 2 days. Why so short-term? Couldn’t I just go further out in time and get more room? Yes. But then I won’t get much theta decay to actually make money on the trade. If my plan is to day-trade this, I need the trade to be very near expiration to capture enough time decay to make money. That, in turn, gives me a very narrow range. In this case I have about 30 points on each side. But that assumes I stay in for 2 days. The plan here is to be out by market close of the same day. Why does that matter? Let’s look at a very normal market day. This was not a crazy day, in fact, it’s a pretty slow day (+10.75 / 0.2% / 0.3 SD). It’s the kind of day you think would benefit this trade.
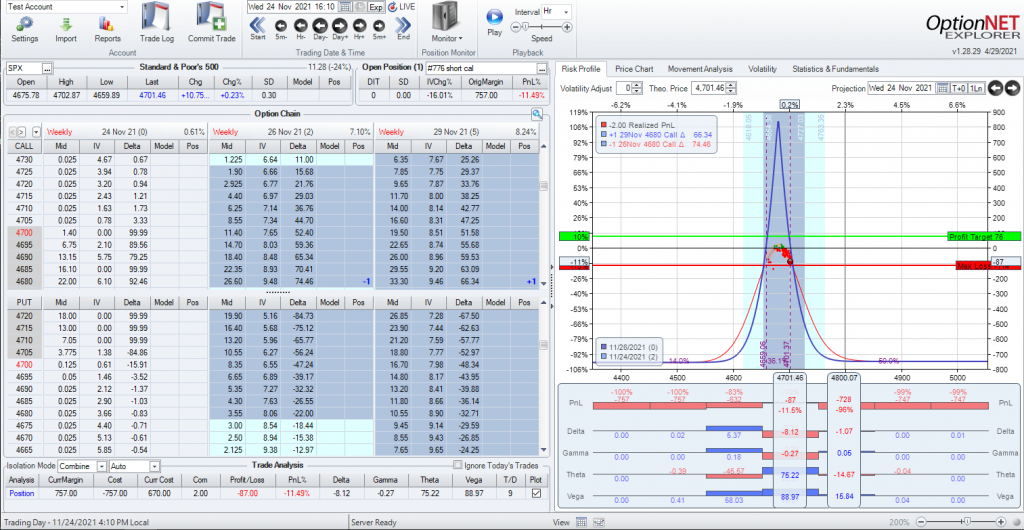
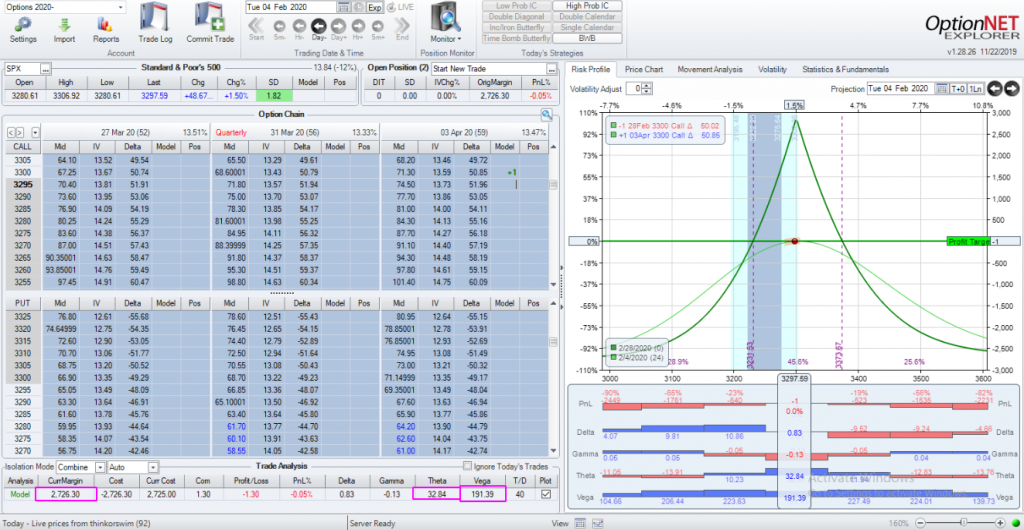
…a few hours later
This is the trade at the close of the day. A definitely loser and that’s on a calm day. Why did the trade not do well? While the time and volatility risks are low since the contracts are near expiration and most of the extrinsic value is gone from the contracts, the price risk is a lot worse than you think because of gamma. Gamma estimates the change to delta and in the last week or so of a contract, it gets very significant. So when this trade was first entered, it had a delta of .47 which is very good. But the gamma was –.30. So with a one point move in SPX, delta would change about 64%. And it only gets worse and the up move continued as you see at the end of the day, delta is now -8.12 and that was on a small move. This is one of the reasons I don’t like expiration week and try to avoid it. The price risk near expiration is much higher than it may appear on a graph.
Could this trade work? Of course. But, again, I don’t think it will win with any regularity. Just like the long straddle needed an unusually large move to win, the day-traded calendar needs an unusually small move to win. These trades, in my opinion, are highly speculative and not low risk even though they may appear to be low-risk at first.
So What Can Work?
Every trade has risk and can lose and it’s easy to pick apart a trade idea and show how it won’t work. But I would be remiss if I didn’t give an example of what I consider to be a good balance between risk and reward. This is not to say that this trade is good for everyone. It can lose money and certain moves can hurt it. I also cannot say that this level of risk/reward is right for everyone or anyone in particular. I have no idea of the skill and experience level of anyone reading this blog. But with all that being said, I would like to present a trade that I like in certain market conditions that I think strikes a balance between risk and reward. It may also help calm down some nervousness involving overnight risk. Overnight (and weekend/holiday) risks are real. But if a trade is well constructed, that risk can be managed most of the time.
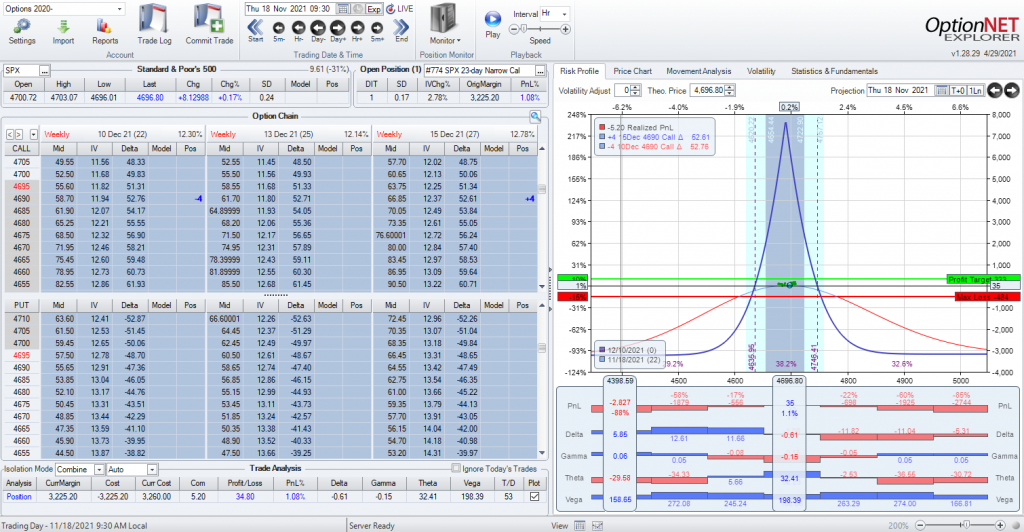
Strategy: A 23-day Narrow Calendar
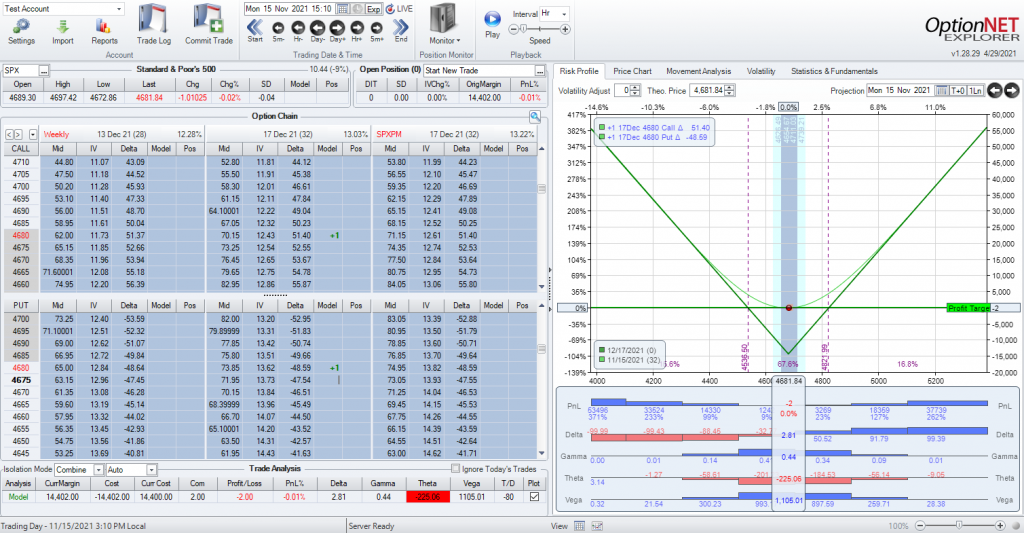
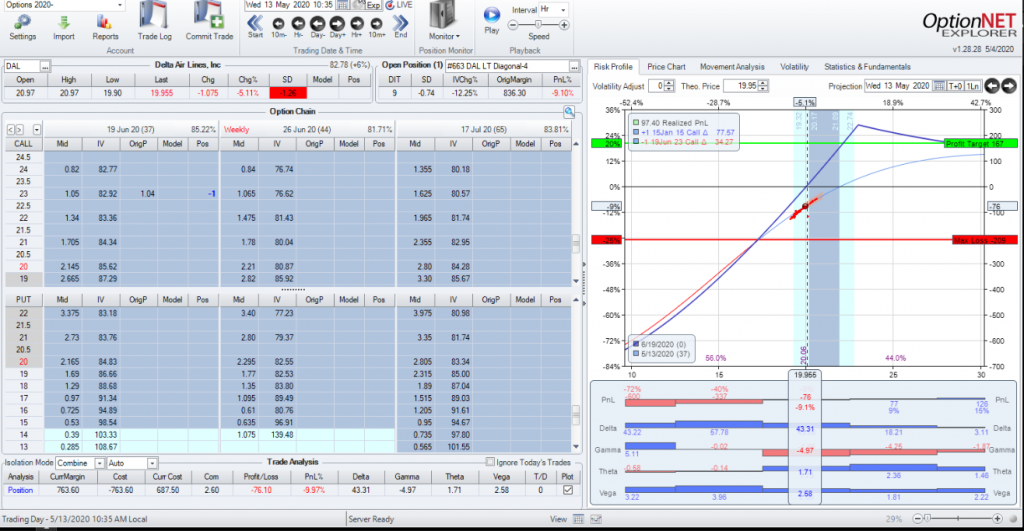
This is real-world example of the last trade I did but I think it works as an example of understanding risk. This is a 23-day Narrow Calendar which is one of my regular trades that I put on most weeks, specifically when the volatility is near the center of the range. Note: Markets can change and as they do, my volatility ranges will change with them. This is based on a range that I’ve been using for the past year and a half, basically since COVID. Because I trade SPX, the VIX is a good estimate of the volatility. This may not be the case for different underlyings so you’ll need to understand the volatility of your particular contracts. But when I put this on VIX was 16.9 which is on the higher side of the middle. This is why I like a narrow calendar. I define a narrow calendar where the longs are less than a week away from the shorts. This is only possible in underlyings that have mid-week expirations, but SPX does. This is the trade when I opened it.
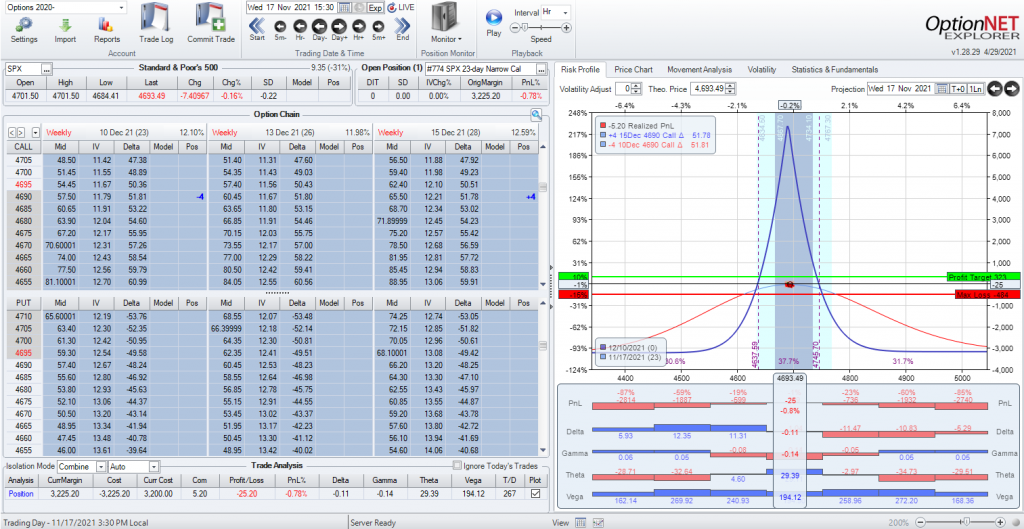
A 23-day Narrow Calendar
The first thing you should notice is the room on each side. Because the shorts are 23 days away, I have between 1.5 and 2 standard deviations of room. This is based on a single day, but that is relevant since the concern is overnight risk. The odds of open open that will go beyond my range is very low…possible but low. And this is how the open looked the next day.
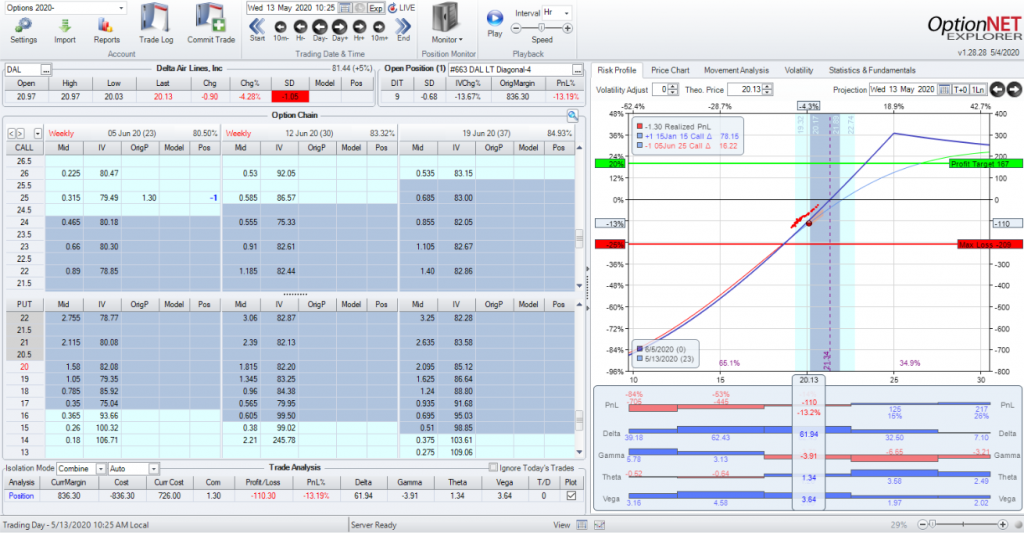
The next day at the open
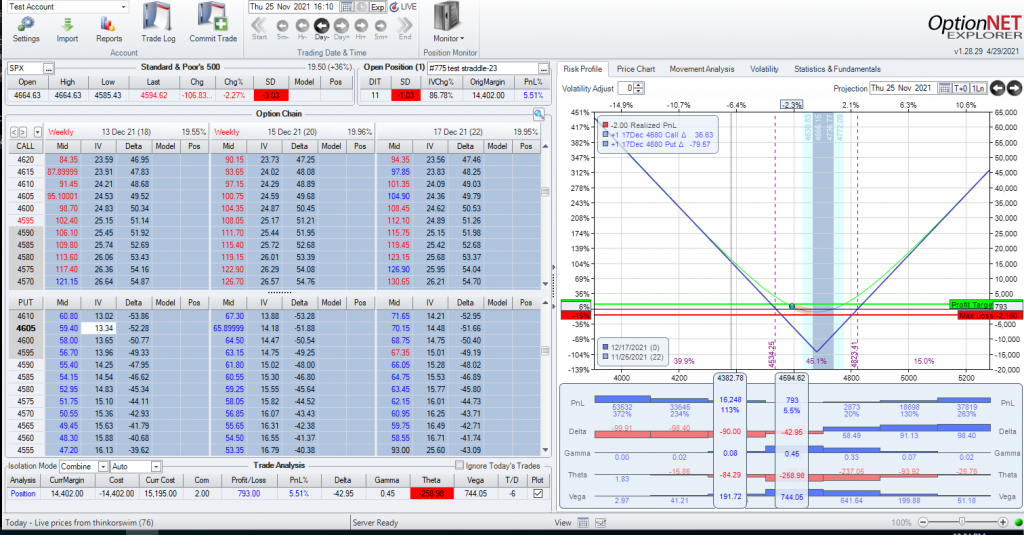
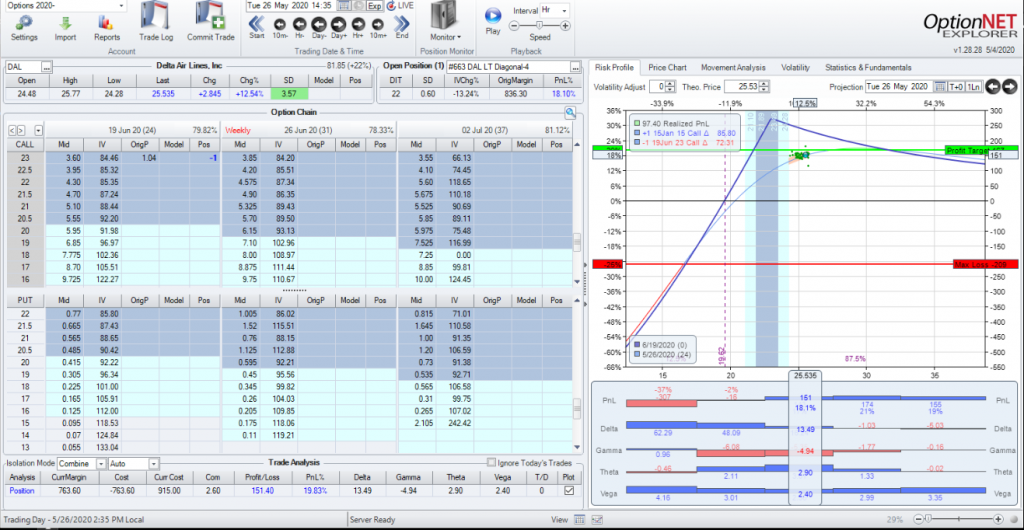
SPX opened up 8 points. Not a problem at all, in fact, I’m up a bit in the trade. For brevity’s sake let’s look at the close of the week (2 days later).
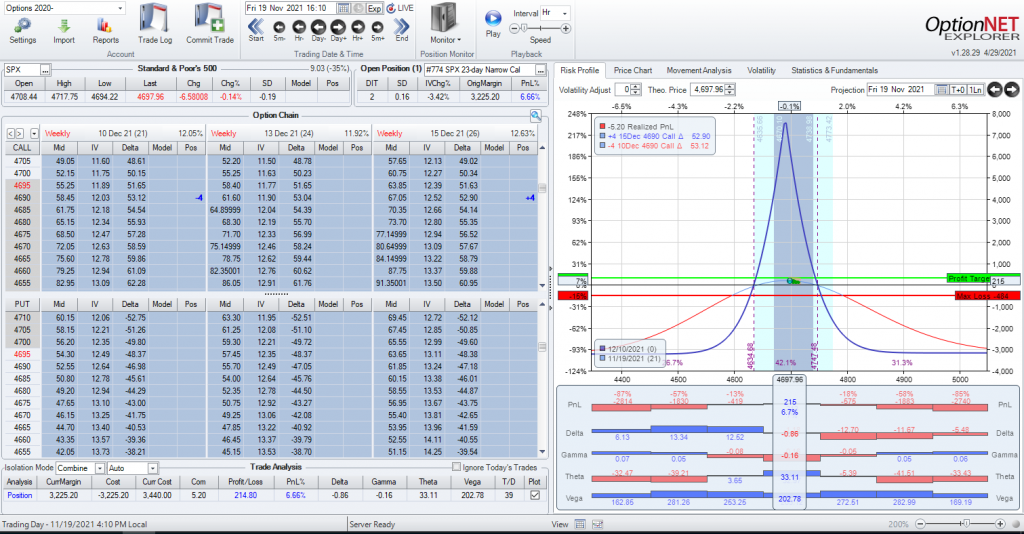
…2 days later
So when the trade went on SPX was at 4693 and 2 full trading days later SPX is at 4698. So the trade is fine. But what about a bigger move? Not a crazy big move, but perhaps more typical market open. Let’s see what happened when I held this over the weekend.
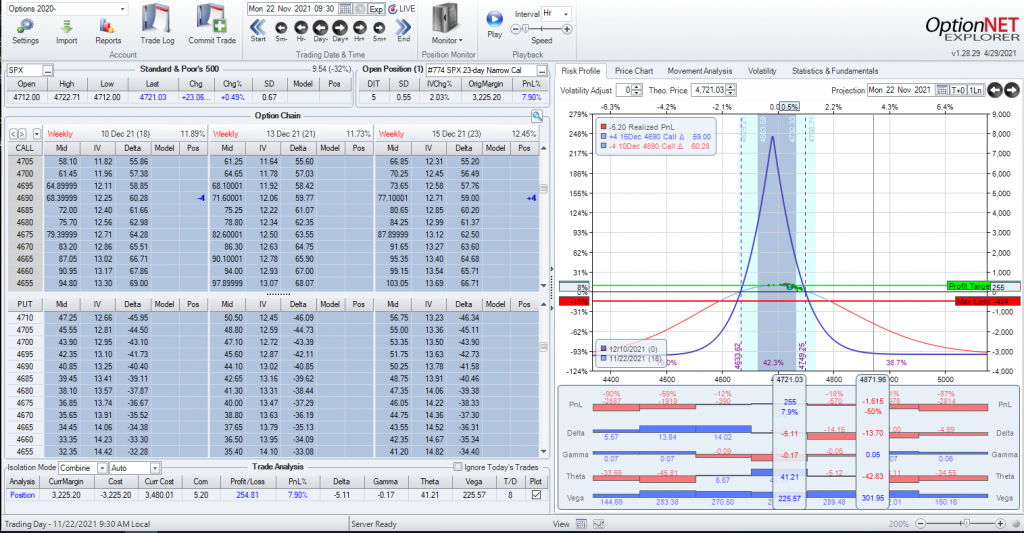
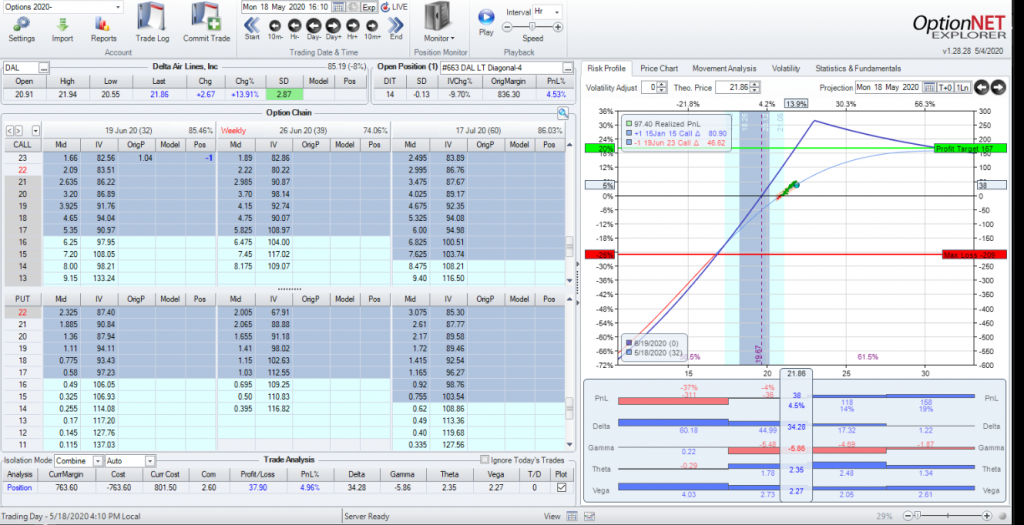
..Monday morning
SPX opened up 23 points (0.5%, 0.67 SD) and the trade is not only fine, but it’s doing very well. In fact, this trade came off around mid-day for about 8.5% (not bad for 5 calendar days). Would it have been doing well had SPX moved 100 points at the open? Probably not. But how often does that happen? Not very often. (Interestingly enough SPX did have a large down move later that week so it’s possible but it’s not common. Maybe a few days a year).
The point of showing this trade is not to promote it or say anyone else should do it but, rather, to help you better understand risk and how it can be managed. This starts with a good trade plan. Had SPX made bigger moves, I had a plan to handle it. In this case, I didn’t need to do anything as the market behaved quite normally. But with any trade, you must be prepared for abnormal things to happen.
My goal in this post is to help demystify risk in the options market. First by identifying the risks and then looking at strategies to face the risks with some examples that look less safe than they are and by showing how I use my understanding of risk to set up a trade. As always, I welcome further discussions on this or other topics relating to options trading. Please reach out to me directly a midway@midwaytrades.com. Who knows? Maybe you will inspire a new blog post.
This content is free to use and copy with attribution under a creative commons license.
 The slope is starting to get steeper as you move towards the edges, especially on the upside. This means that if SPX moves in that direction, you will become more directional as delta and gamma increase and each move up hurts the trade more. The downside certainly looks better but keep in mind as well that a sharp move to the downside will spike volatility and so the curve won’t be quite a generous ad the graph currently shows. So if you let the trade go to either side, you may have some white knuckles while you are holding on. Alternatively, you can adjust but most of these adjustments reduce the total credit of the trade which, in turn, lowers the amount of the win. If you over-adjust this, you may end up with no credit left and, at that point, the trade will just lose.
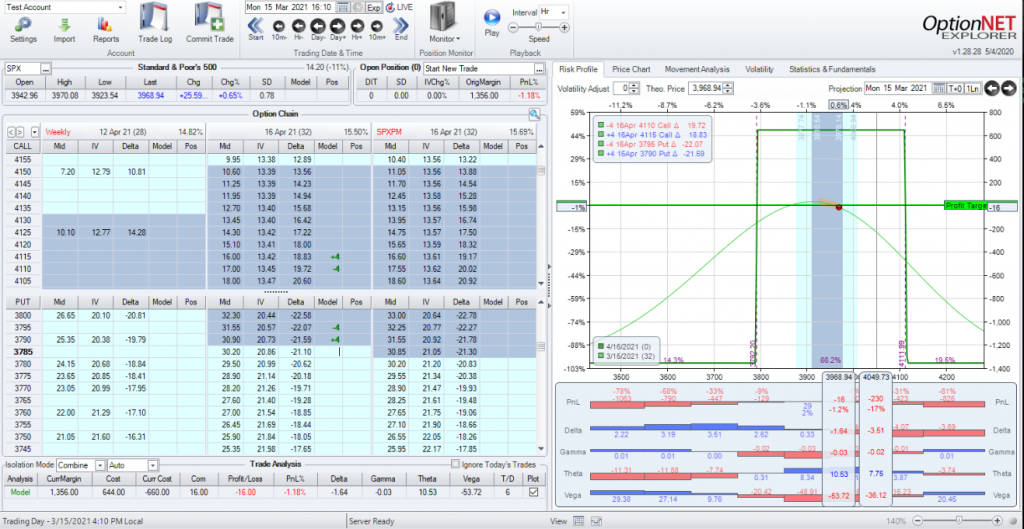 In this trade, I’m selling around a .20 delta on each side. In this case I sold a 4-lot to try and keep the risk close to the other trade. In this case, it’s a bit more at $1356. However, my credit is now $660 (or $644 after my expenses). This puts my risk/reward at about 2x. I certainly like this better. But the downside is my range is now 140 points on the upside and 176 points on the downside. That’s a significant difference and it brings my probability of profit down to about 66%. On the positive side, my theta is better at about $10.50/day at the beginning of the trade. If I had to trade an Iron Condor, I like this better than the first one. However, this puts your risk/reward closer in line with other trades that I like better.
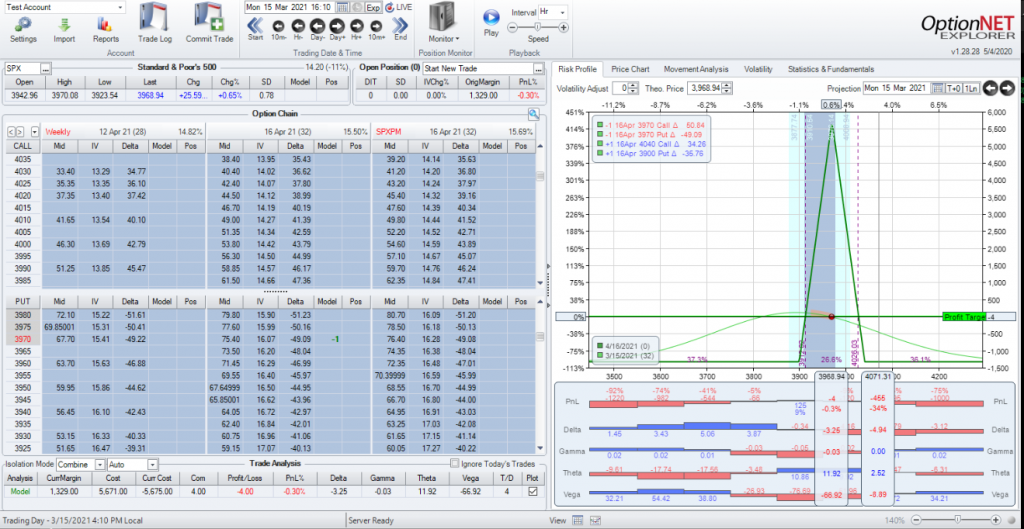 With this trade, my range is very narrow compared to the Iron Condors. And, with this trade, the width of the structure is determined by the width of the spreads themselves rather than the distance between the shorts since that distance is zero. So why do I like this trade better? It’s not the range as, in this case, I have around 70 points in each direction which gives me an expiration probability of about 26%. But, remember, I have no plans on staying to expiration week, yet alone expiration day, so the expiration probabilities don’t mean as much to me. I’m far more concerned with the next week or two. Ideally, I’m out of this trade in 2 weeks or less. My total risk is between the two Iron Condors at about $1330. but I took in $5671 in credit. That flips the risk/reward ratio over to the reward side. Now, with any butterfly, the goal should never be to get the maximum profit as the underlying would have to expire on the exact short strikes which is akin to winning the lottery. But, I’m usually trying to make about 10% on these trades in far less time and having that large total credit gives me plenty of room to reach it, even if I had to reduce the total credit with adjustments. And if I was actively managing an Iron Condor, especially the lower probability example, if the underlying moved 70 points in either direction, I’d probably have adjusted the Iron Condor as well which means the work to maintain each is similar given similar market conditions. I also like the starting Theta of about $12/day even though my total risk is a bit lower than the lower probability Iron Condor.
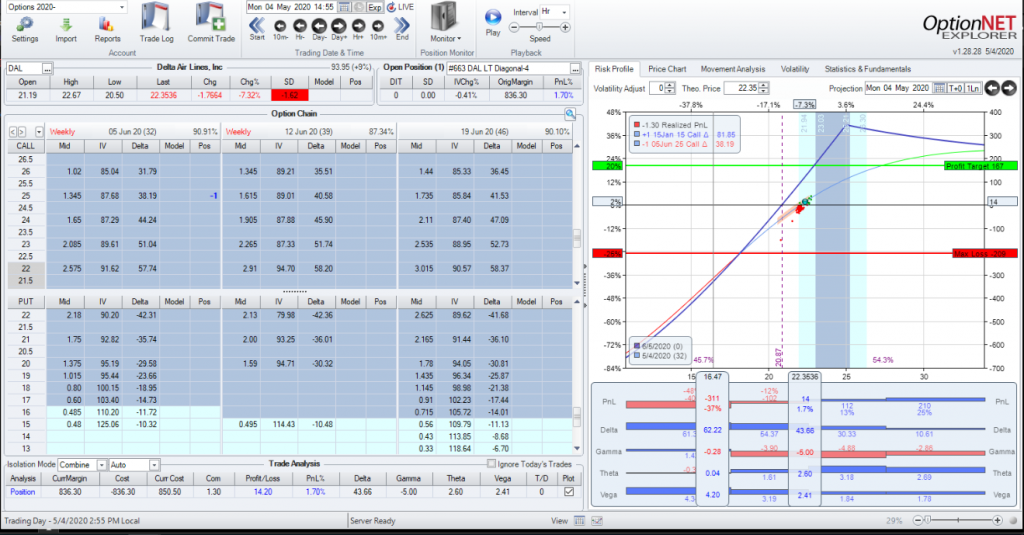
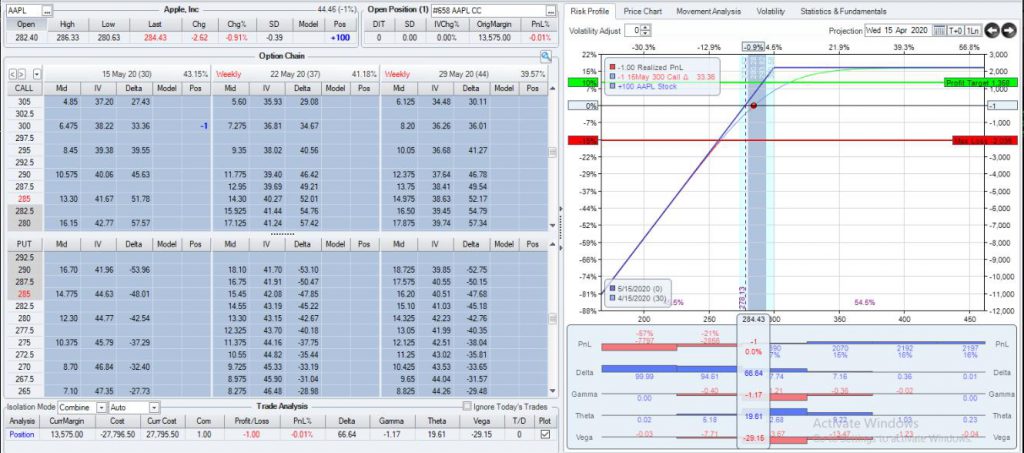
 This is a common setup for a butterfly for me. It’s an unbalanced butterfly 44 days out, 40 points up, 50 points down which makes a nice flat delta trade with .80 deltas on a 2-lot. However, 2 days later the trade looked like this:
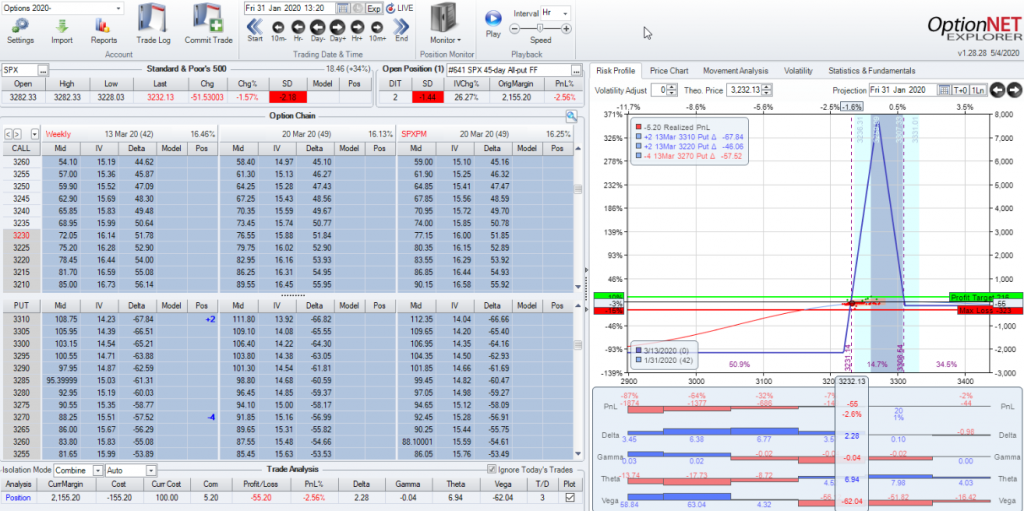 SPX moved 51 points down in a day which constituted a 2 SD move. My trade is at an adjustment point so instead of trying to buy a lower fly, I add a put:
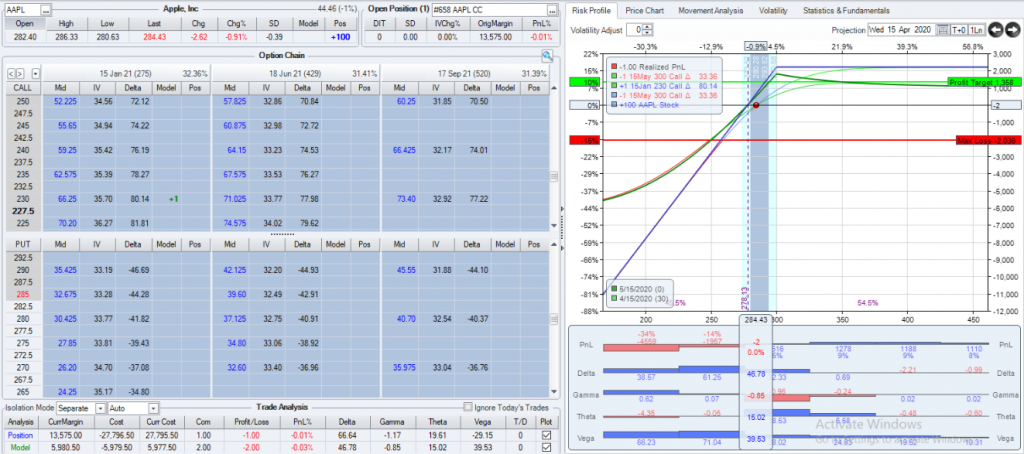
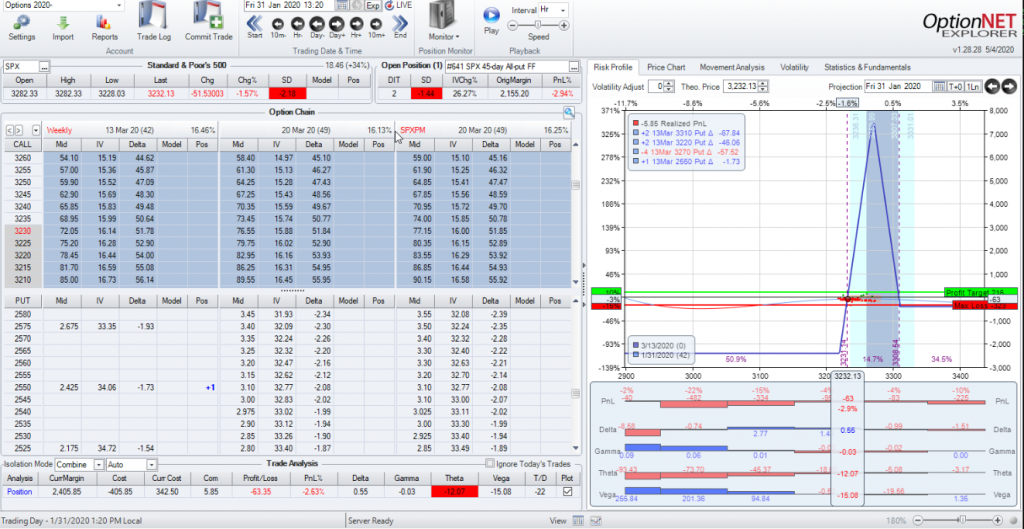 I bought a 2550 put (way out of the money). This is because to cut my deltas by about 80% I needed around 1.75 deltas. But now I’m not worried about the trade getting into trouble on the downside and I can wait it out and see what happens given that I’m really flat so that price movement doesn’t scare me. In return for that, my position is negative theta at the moment. While I don’t like that, I’ll take it for now to help stop the delta/gamma bleeding. When I bought the put it had 42 days left in it. That means I’m willing to keep it on for about 8 days before I need to sell it outright or roll it out. This happens to be a Friday so I kept this put on over the weekend and even into the early part of the week. It wasn’t until Tuesday Feb 4 that the trade looked like this:
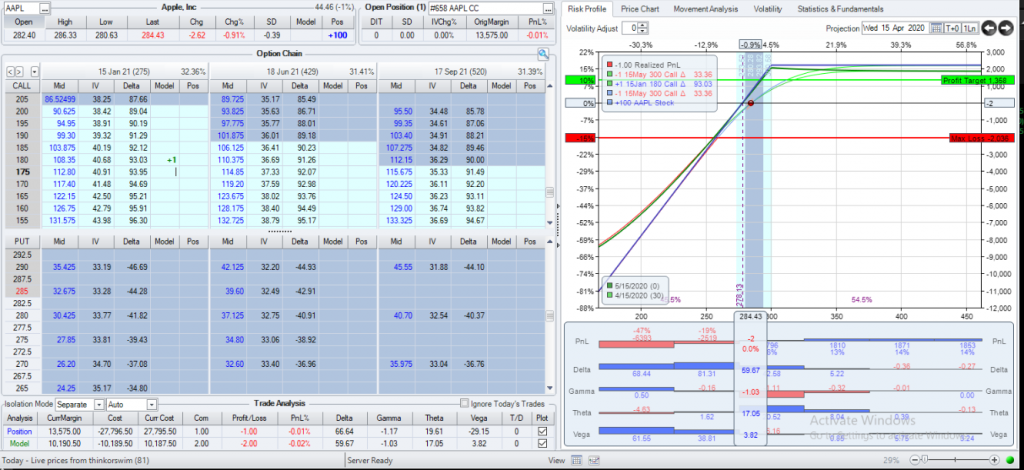
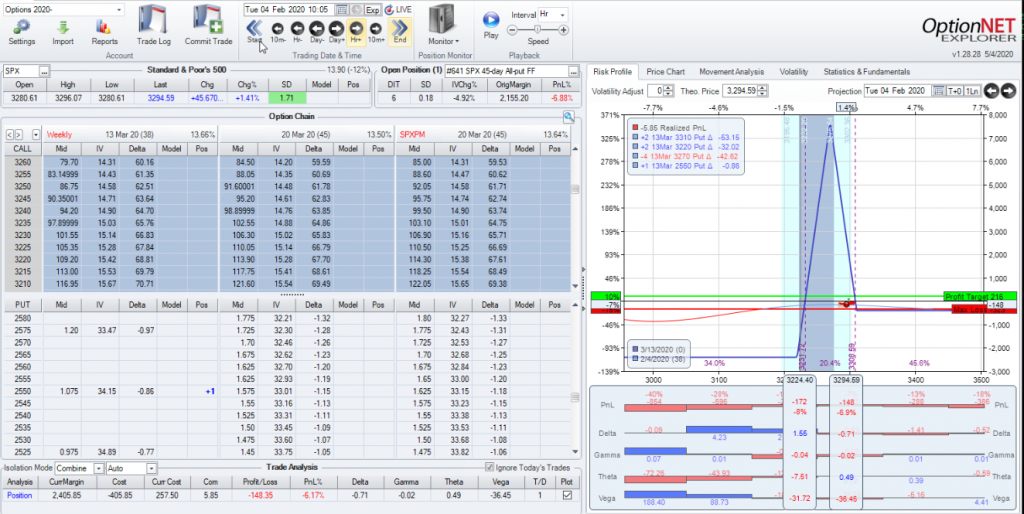 Note that we had a big up day that put the stock above the middle of the fly structure. At this point it’s time to sell it off at a loss. I lost a bit over 50% of the value of the put but it was just insurance that wasn’t needed. On the plus side, I didn’t pay much for it and this trade eventually closed for a small win. In perfect hindsight, I could have done nothing and done better but there was no way to know that at the time and it was better from a risk management perspective to buy the put and protect the position so that it did not get out of control and become a big loss.
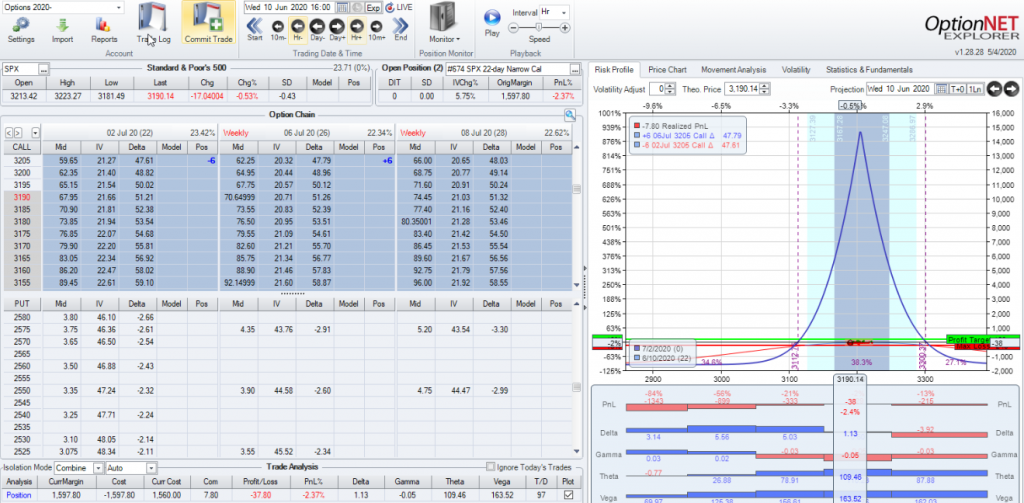 This is a very typical trade that I put on for much of this year. In the crazy market we’ve had this year, I really like the initial room this trade has and the relatively low vega exposure for a calendar. However, the very next morning I woke up to this:
 So in the first hour of trading SPX is down 2 SD and my trade is at an adjustment point. This was a rare exception where I was able to put on lower calendars as an adjustment. Had I not been able to get a good price on it, I would have gone right to the put, but since I was able to do so it looked like this:
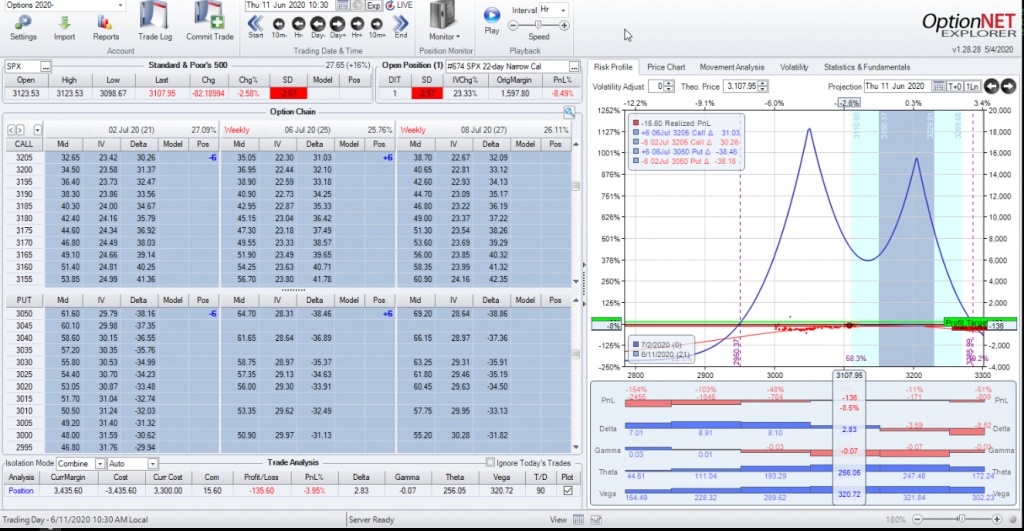 So I got my double calendar on and I have a lot more room now, right? Not so fast, later that same day….
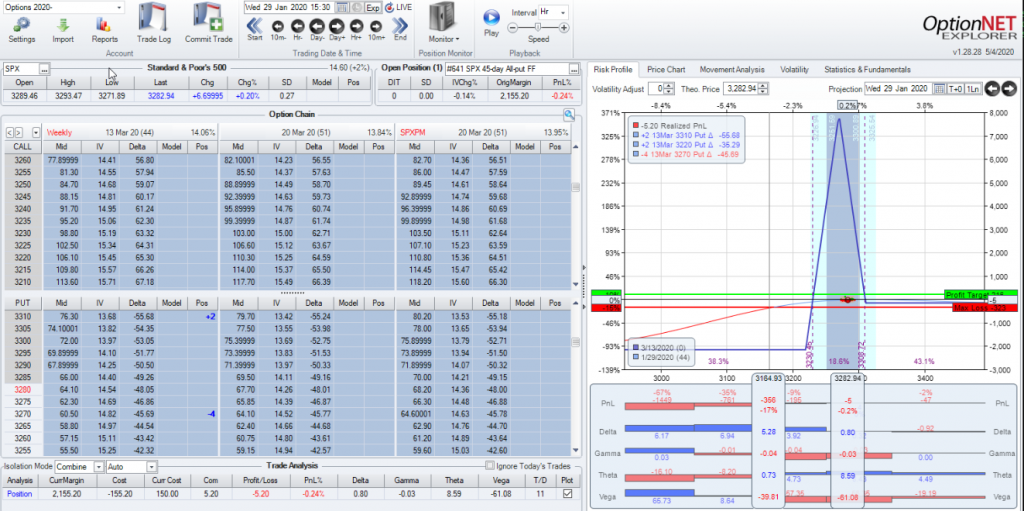
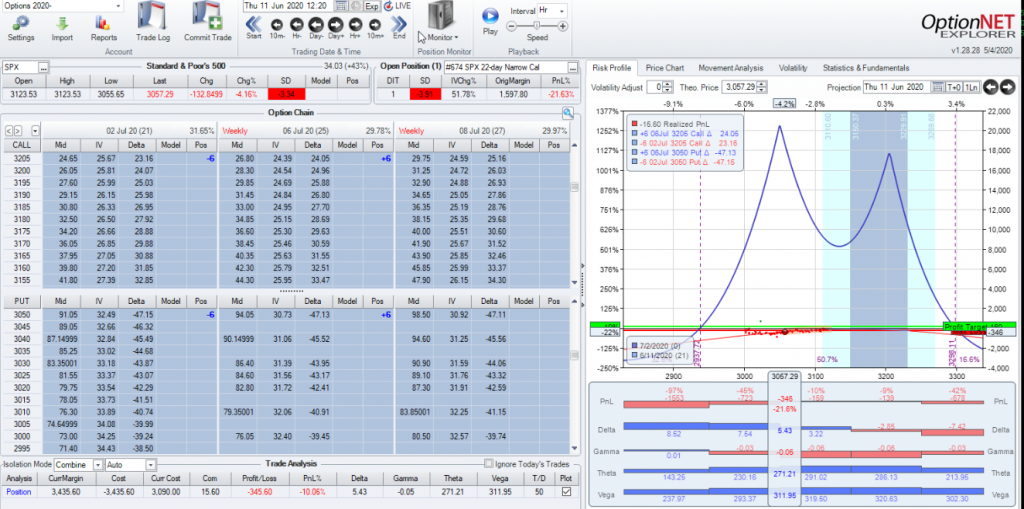 Just 2 hours later, SPX is now 133 points down or 3.3 SD down. At this point there is no way I’m going to try and take off the upper calendars (I was lucky enough to get the lower calendars on when I did), so I go ahead an buy a put:
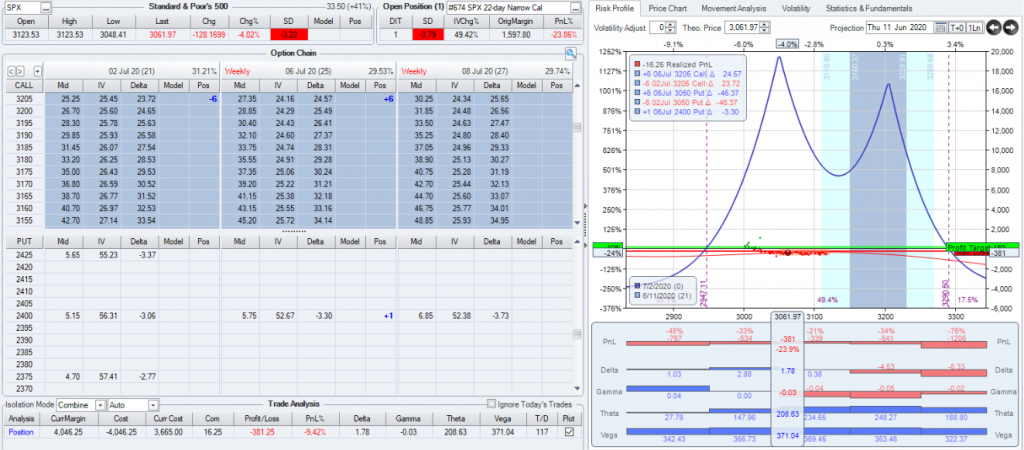 By buying a 2400 put in the back side of the calendar I was able to cut my position deltas to 1.8 from 5.4 and stop any more bleeding. The next day, the market calmed down and I was able to properly take off the upper calendars. At that point I was able to sell off the put since, with my proper adjustment, it was no longer needed.
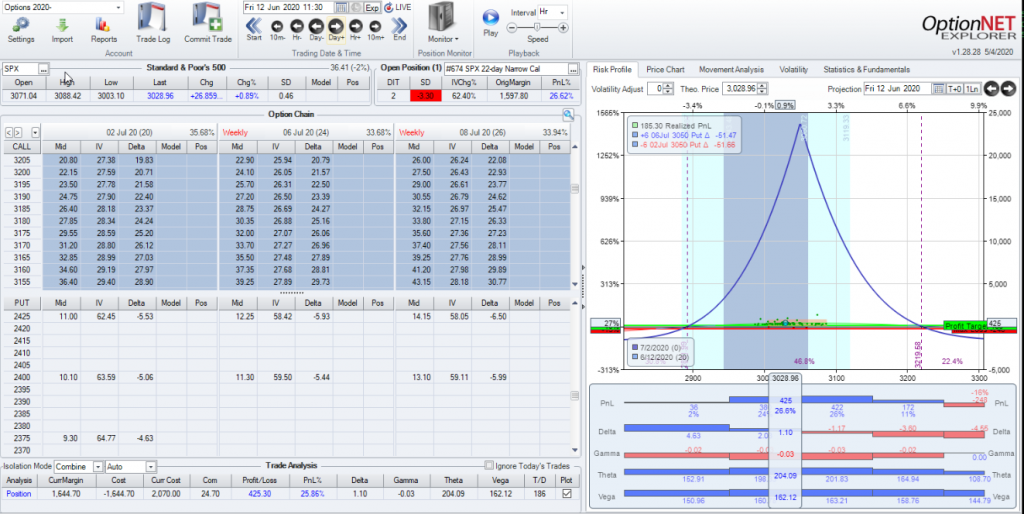 Now the trade is back to normal and, in this case, I was able to sell the put off at a profit. While that was never the goal, it was a nice bonus. This trade ended up doing very well (over 30% profit) and it was made possible by being able to weather the quick storm that came through the market.
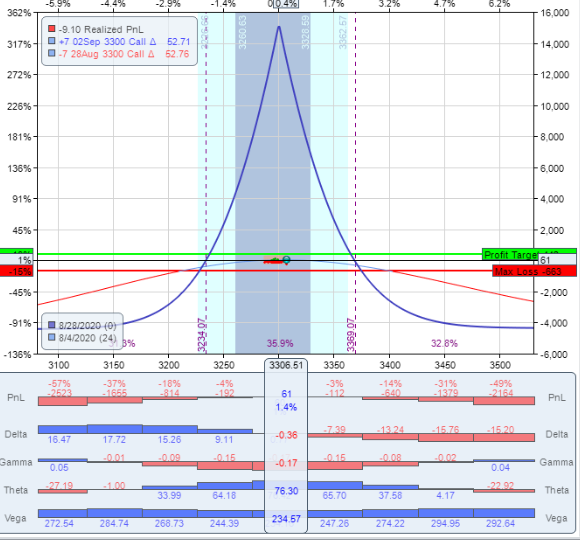

 If you have pets, as I do, you understand that they are more than just animal companions. To many of us, our pets are part of our family. We do our best to take care of them, feed them, get their shots, make sure they have the best life we can give them. When they get sick, we collectively spend billions of dollars a year getting them the best medical care we can. When they die, we mourn them. And, outside of truly obsessive behavior, all of that is perfectly fine and normal. We take in these animals, keep them in our homes and our lives and treat them and protect them as our own.
 A farmer or rancher also has animals. He takes them in, feeds them, and protects them. But it’s very different. Those animals are not part of his family. His goal is to eventually sell these animals to make his living. If one of his animals gets sick, he is far less patient with medical care. Time and costs matter and he can’t let one sick cow infect the entire herd. While he may try some limited things to make that cow better, if that fails the cow must be put down and he moves on and focuses on the rest of the herd. To the rancher, the animals are a business asset. They exist to make him money to feed and protect his family (and his family’s pets). But he doesn’t have the emotional attachment to his cattle like he has with his pets.