Mid-Year Review: 2026
A Good Start
The first half of 2026 was quite successful. There's several reasons for this, the market cooperating with my trading style is always one of them, but I made some changes last year in how I trade that I believe has carried over into 2026]. Here's a monthly breakdown of how things went.
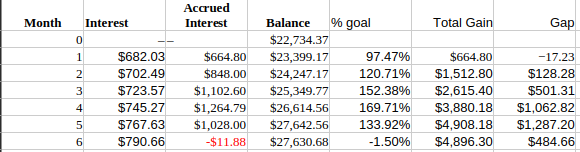
The first thing that stands out is that I had one losing month (June) and it was really small. And I had built up a good cushion before June such that I'm still ahead of my annual goal for the year by about 10%. This is because Feb-May were all over goal. June was definitely a challenging month and July has definitely started slow. Some of that is seasonality and, at least for the past 2 years, IV has really dropped. I'll get into how I intend to tweak what I'm doing later. But the #1 thing that has kept me going this year has been very good risk management. The stats that back this up are here.
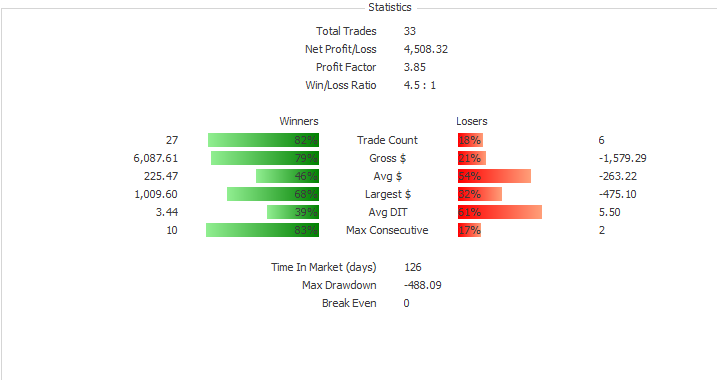
What stands out to me is the formula I use to manage my trades properly is working well. The win rate was 82%, but that's not the really important part. What's key in this data to me are the Average win vs loss and the biggest win vs the biggest loss. My goal is that with at least a 70% win rate (I expect around 75%, but I think the rule applies even at 70%), I need to keep my losses no more than twice my typical win. As you can see, my average win and average loss size is nearly identical. So using the average as “typical”, my losses shouldn't be more than around $450. My largest loss was $475, so not perfect, but pretty close to that.
The other thing I find interesting is the number of days in market. I had open trades for 70% of the days over this time period. I've never really tracked this before, but I might going forward. It goes to show that you don't have to be in all the time to succeed. I had a significant amount of travel this year and spent at least some of that time out of the market, especially in June when I only put on 4 trades.
Visualizations
Now for the other graphs where I may be able to glean some insights.
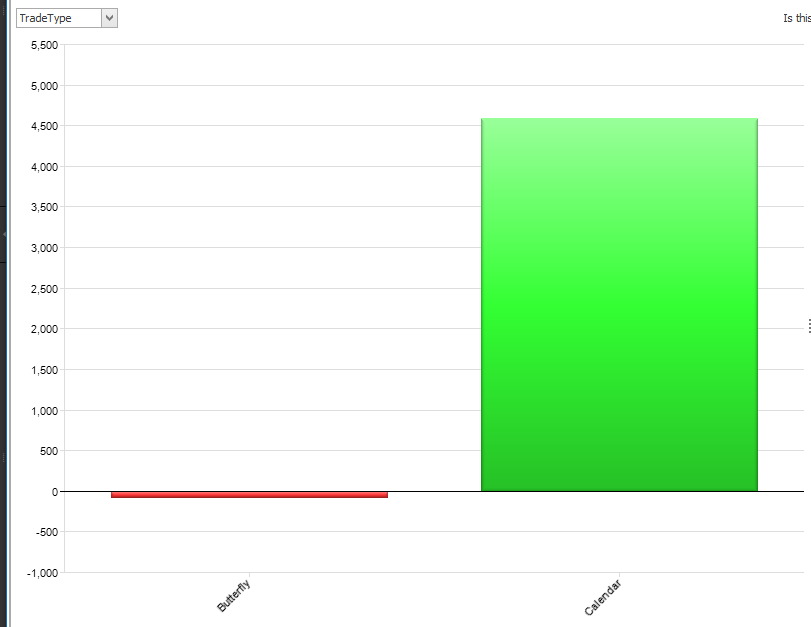
Not much to see here other than I put on almost exclusively calendars. I did 3 butterflies and they didn't do much for me. It's not that flies are bad trades, I've made money in them before but, as the range of IV has been higher recently, I've found that calendars can work in higher IV environments that I was used to. Next, let's look at Days to Expiration.
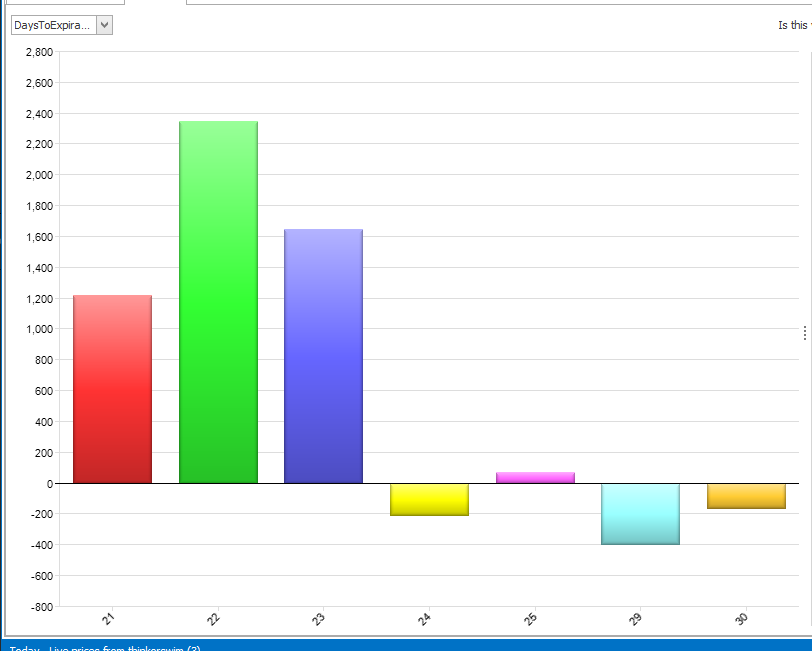
This shows a significant change in my trading. First, no trades less than 3 weeks and the sweet spot is right around 3 weeks. This is a direct response to last year where I saw that shorter term trades didn't really work as well so I decided to de-emphasize them and I guess I really took that to heart. I did a few trades closer to 4 weeks out. Two of those trades were butterflies that didn't so much and I did go a bit further out in time based on trying to find the starting IV I wanted in my calendars. I'm still playing with that idea. I may write about it once I get more data. Now, let's see how long I stayed in these trades.
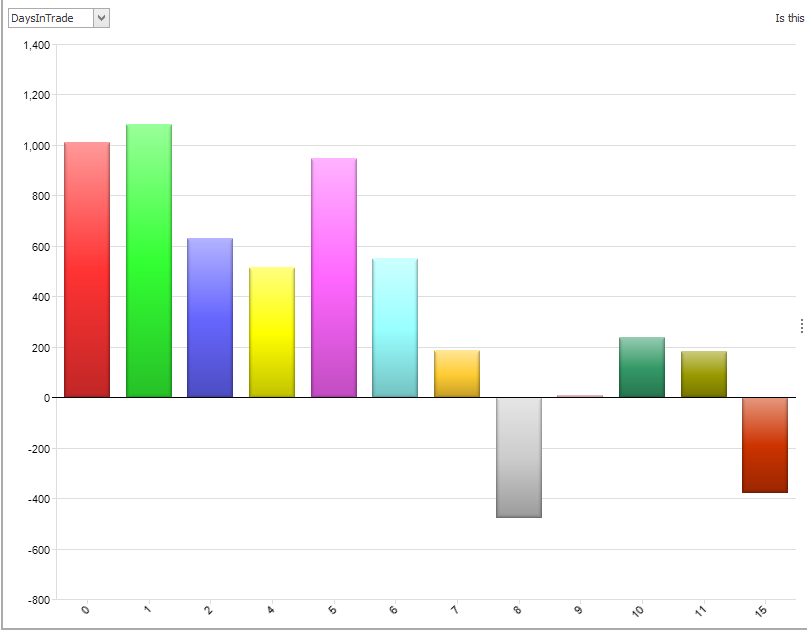
From this 1 week is the sweet spot. I'm ignoring the 0 DIT trade that, while very successful, was a fluke that I don't expect to repeat. That trade lasted 14 minutes. But what's important here is that after a week, I need to keep trades on a shorter leash. Where I have usually messed up a trade is staying in too long trying to make it work. I have really tried to embrace my Pets vs Cattle mantra and this stat helps support that.
Lessons Going Forward
It's sometimes tougher to come up with things I want to do better when I had a lot of success over the last 6 months (and really the last 12 months) but one thing really stood out...June. June was a tough month for me as trades just seemed to take a really long time to make any money. My calendars this year have been 4 days between the shorts and the longs. That has worked really well for a good while but now that market volatility has dropped overall, 4 days is starting to act like 3 days. I played with 3 days apart in the past and stopped doing them because the real theta was much slower than the mathematical theta. That leads me to think that as overall IV is lower, that I should consider widening my calendar width to 5 or even 7 days, at least in the short term. So as VIX is in the very low range for the past 2 years (in the 15s), I am going to experiment with wider spreads to see if I can get money out of them in the time I expect. This may be a temporary thing, maybe not. But I can't expect the market to cooperate with what I'm doing. I have to adjust what I'm doing to try and fit the market. I'll track the success rate of this and report on it next time.
Until then...good trading.
This content is free to use and copy with attribution under a creative commons license.